→ Open the Data Explorer in a new tab.
Food prices refer to the average price of particular food commodities globally and across countries.
The price of goods not only provide an important indicator of the balance between agricultural production and market demand, but also have strong impacts on food affordability and income. Food prices not only influence consumer affordability, but also influence the income of farmers and producers. In low-to-middle income countries in particular, a large share of the population is employed in agriculture. Producers typically benefit from higher food prices; consumers from lower prices. Food markets can therefore have a strong impact on food affordability, hunger and undernourishment and dietary quality.
This entry presents the empirical overview on global and country-level food prices and expenditure, spanning the long-term to very recent changes.
All our charts on Food Prices
Three billion people cannot afford a healthy diet
Being able to eat a healthy, nutritious diet is one of our most basic human needs. Yet billions of people go without; they suffer from ‘hidden hunger’, micronutrient deficiencies such as too little iron, calcium, vitamin-A or iodine.
There are many reasons why someone might not eat a nutritious diet.1 Often it’s because people cannot afford to.
To understand the affordability of food across the world a team of researchers looked at the lowest-cost options to meet basic nutritional requirements.2 As part of this study for the FAO’s The State of Food Security and Nutrition in the World report, Anna Herforth and colleagues asked the question: “what is the cheapest way to meet dietary requirements in each country?”.
They answered this question using data on prices for locally-available food items from the International Comparison Program (ICP) matched to other data on food composition and dietary requirements.
You find their full set of results in our Food Prices Data Explorer.
An energy sufficient diet: hundreds of millions cannot afford one
Let’s start with the most basic requirement: getting enough calories. These calories could come in any form, but the cheapest option in most countries is starchy foods and cereals. Living on this ‘energy sufficient’ diet would mean eating only maize flour or rice for every meal, a diet that is severely lacking all other important nutrients. When you look at people’s diets you see that in poor countries, people get most of their calories from starchy foods.
In each country, prices were measured at retail marketplaces specific to the local context – this could be anything from small open stalls to large supermarkets, whatever is most representative for the country.3 The total costs of diets are given in international-$.4
In the following text I always refer to international-$, but only use the $-sign to keep the text readable.
A person can eat an energy sufficient diet on less than $1 a day. The global average price for this diet across all countries in the study was $ 0.84 per day.
What does this mean for the affordability of a calorie sufficient diet? The researchers define ‘affordability’ by whether someone can afford it if they spend 63% of their income on food. The concept of ‘affordability’ is a somewhat subjective one, and will depend on an individual’s context. People at higher incomes spend a much smaller share on food. The relationship between our income and what we spend on food follows a fairly consistent pattern, known as Engel’s Law. Engel’s Law describes the empirical regularity that as incomes increase the share that we spend on food decreases (even if the total amount that we spend on food increases). We see this relationship holds true when we compare food expenditures across the world.
This means the poorest households spend a very high share of their income on food. The researchers chose this ‘63% threshold’ because this is the share that people at the lowest incomes do typically spend on food.
By comparing the cost of diets with income distributions across the world, researchers estimated that 275 million people could not afford the most basic energy sufficient diet in 2017.5 These are the very worst-off in terms of nutrition.
An important question is how subsistence farmers fit in. They are included in these numbers: the income measure used to calculate the affordability of diets does take the value of subsistence farming (i.e. home production) into account. When the FAO report states that these smallholder farmers cannot afford a calorie-sufficient diet, they’re really saying that they cannot produce one. This state – where farmers struggled to produce enough staple crops to feed their families – was the default position in the past. Most of the world population was undernourished. As a recent study on the history of global poverty estimates, just two centuries ago around three-quarters of the world “could not afford a tiny space to live, food that would not induce malnutrition, and some minimum heating capacity.”6
Today we might think of this calorie-sufficient threshold as the nutritional equivalent to the $1.90 international poverty line. It is the absolute bare minimum. It is a very low threshold that allows us to identify those living in the most dire of circumstances.

A healthy diet: three billion people cannot afford one
What people really need is a diverse and nutritious diet. Getting enough calories is important, but it is not sufficient to live a healthy and productive life. Eating only cereals and starchy foods will leave you deficient in protein, essential fats and the wide range of micronutrients that our bodies need to function optimally.
Most countries develop ‘food-based dietary guidelines’ which provide recommendations on what a ‘healthy diet’ would look like. This includes guidelines on what balance of foods across the many groups – cereals, fruits, vegetables, legumes, meat and dairy – is considered best for long-term health.
The researchers also looked at the lowest-cost options to meet these national food-based dietary guidelines. Of course, there is no universal ‘healthy diet’, particularly when we consider the strong cultural differences in what people eat. So, the researchers selected dietary guidelines which were regionally representative: this means we’re not expecting that people in India or Japan will adopt the national dietary guidelines of the United States, or vice versa.
Unsurprisingly, a diverse, healthy diet is much more expensive than a calorie-sufficient one. The researchers found that the average cost across the world was $3.69 per day. That’s more than four times higher.7
When we put these prices in the context of affordability – again defining this as spending 63% of our income on food – we find that three billion people cannot afford a healthy diet. In many of the world’s poorest countries – particularly across Sub-Saharan Africa – it’s unaffordable (or not producible) for most of the population. This is shown in the map which gives these figures as a percentage of the total population. In many countries, a healthy diet is out-of-reach for more than 90%.

How do incomes around the world compare with the price of a healthy diet?
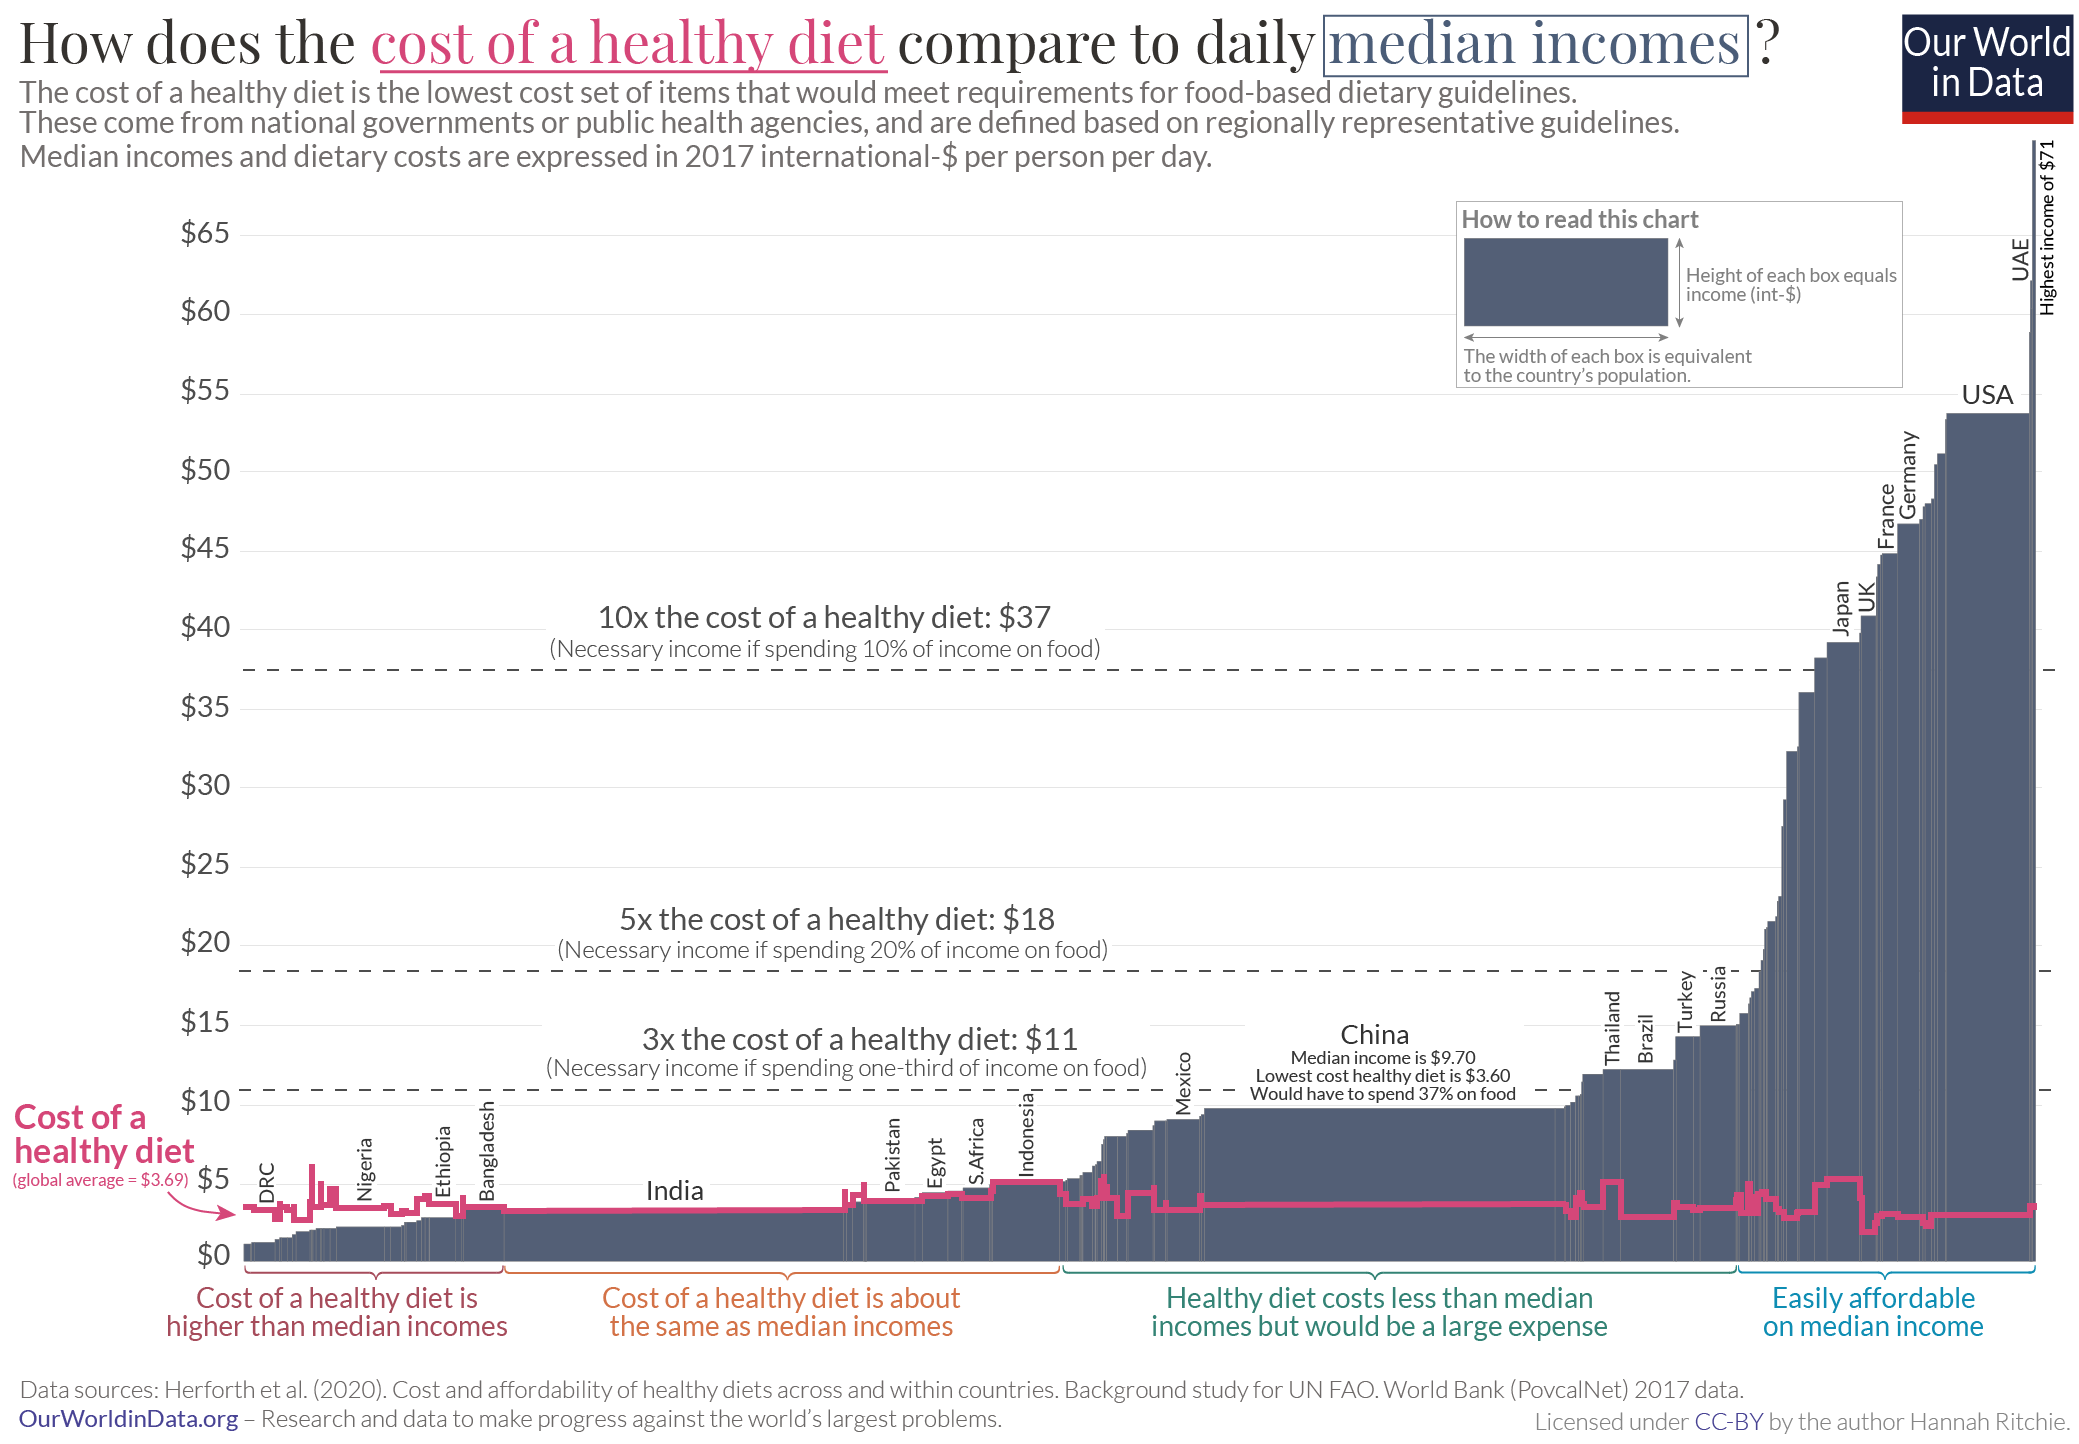
A useful way to bring context to food prices is to compare the cost of a healthy diet with the median income of countries across the world.
Both of these distributions are shown in the chart. First I’ve plotted the income distribution of the world in blue – the height of each box corresponds to the median income of each country in 2017. The poorest countries you find on the left, the richest on the right. The width of each bar represents the size of the population in that country.
These are measured in international dollars, which correct for cross-country price differences.
On top of this income distribution I’ve added the cost of a healthy diet for each country – shown in pink.
In the poorest countries, the cost of a healthy diet is higher than the median income. Even if the average person in these countries spent all of their money on food, a healthy diet would be unaffordable.
In some countries – India is the largest among them – dietary costs would be roughly equal to the median income. There people would need to spend all of their income on food to afford a healthy diet.
Towards the right we find the world’s richest countries. There, median incomes are much higher than dietary costs. In these countries the median income earner can afford a healthy diet with a relatively small fraction of their income. The average person in France could spend just 6% of their income on food. In Denmark, just 5%.
What this comparison shows is how far most of the world is from being able to afford a healthy diet. We cannot spend all, or even most, of our income on food. We would have very little to spend on other essentials such as energy, housing, clothing, education and healthcare.
On this chart I’ve also drawn lines that show us what level of income you would need if you were to spend one-third; 20% or 10% of your income on food. This is equivalent to the share that people in high-income (10% to 20%) and middle-income (one-third) countries spend. Median incomes would need to be anywhere in the range of $11 to $37 per person per day.
There’s no definitive answer as to which of these income levels is ‘right’. But considering it in this way gives us some indication of what minimum thresholds might seem reasonable to aim for given the cost of healthy, nutritious diets across the world.
The world has come a long way in making a calorie sufficient diet more attainable. Undernourishment is no longer the default state like it was in the past (although it is still a sad reality for many of the world’s poorest). The world managed to achieve this through technological advances in agriculture: we can now grow much more food. This happened alongside a significant rise in incomes across the world.
This ratio between food prices and incomes – called ‘real incomes’ is key. If we’re to make a healthy diet affordable for everyone, we need to see large increases in real incomes. As we explain in our recent article, an increase in real incomes means economic growth.
We still have some way to go to ensure everyone can afford a calorie-sufficient diet. What this latest research shows is that we have much further to go to ensure that a healthy diet is affordable in all countries across the world.
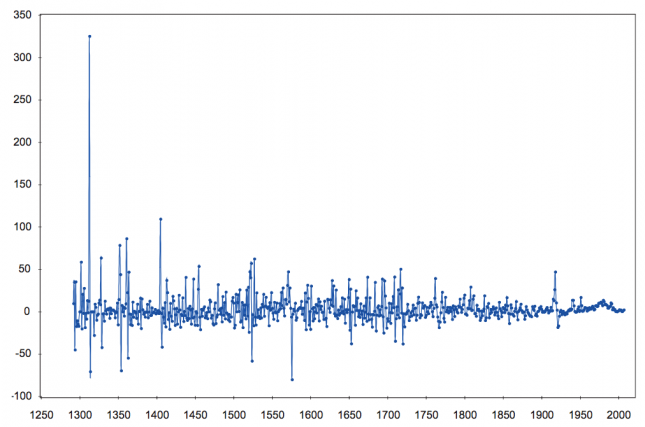
Wheat prices since the 13th century
The visualisation shows the price of wheat in England over more than 7 centuries.

Long-term food commodity prices since 1850
This visualisation shows long-term commodity price indexes across various food items since 1850, relative to real prices in the year 1900 (i.e. prices in 1900 = 100).

Food prices compared to wages
These visualisations show the relative difference in average USA manufacturing wages relative to the price of food commodities based on Bureau of Labor Statistics data.8


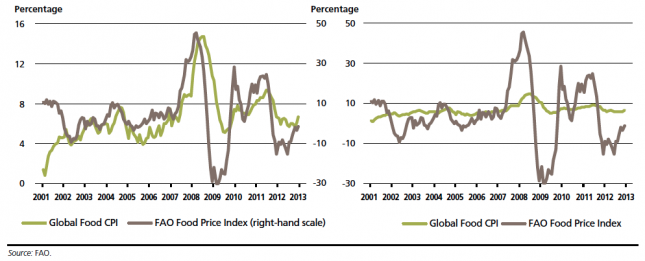
The FAO Food Price Index (FPI) is a measure of the international prices of food (e.g., between suppliers or nations), while the food consumer price index (CPI) is a measure of the price of food to the actual consumer. The graphs shown indicate that “the FPI translate to higher consumer prices only to a very limited degree and with a time lag of a few months.” The lag is often due to the time needed to harvest, transport and process food to the consumer. The limited relationship in the magnitude of the two indices “is explained by a combination of factors that determine vertical price transmission in every food economy, including mark-ups for transportation, processing and marketing, and by any subsidies at the consumer level.”9
Global food consumer price index (CPI) & FAO food price index (right-hand scale), 2001-2013 – FAO (2013)10
Consequences of High Food Price Volatility
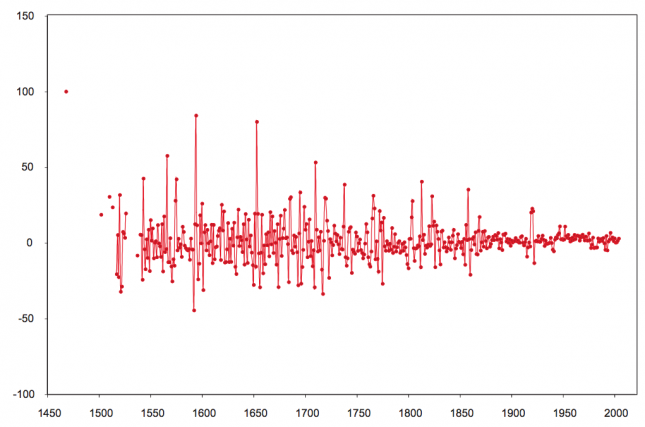
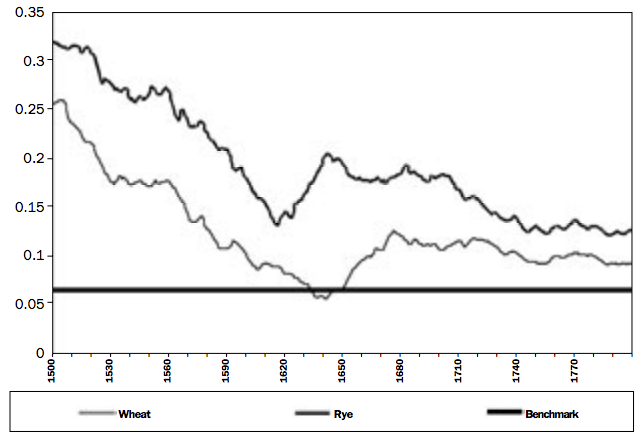
The volatility of food prices matters especially for the wellbeing of poorer people since the price increases can translate into shortages of food supply at low income levels. These visualisations show the declining volatility of the real value of wages (adjusted for price changes) over the very long-run in various locations.
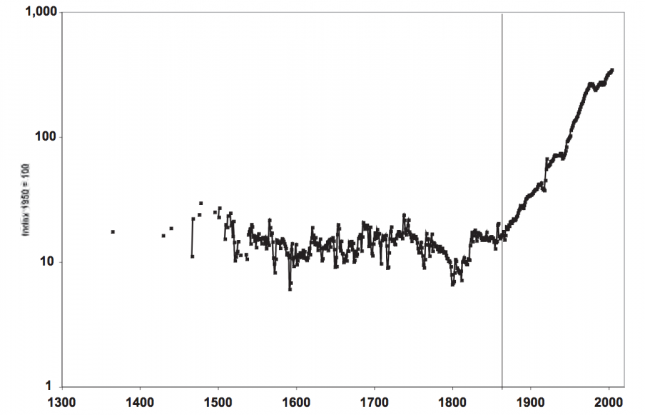
Especially important for this decline in real wage volatility was increasing integration into larger markets, such that poor harvests in one area could be compensated by importing food from regions less affected by bad harvests.
Volatility of real wages of laborers in Stockholm/Sweden, 1468–2004, measured as the percentage year-on-year change in real wages – Söderberg (2010)11
Real wages of unskilled laborers in Stockholm, 1365-1864, and industrial workers in Sweden, 1865–2004 (index 1950=100) – Söderberg (2010)12
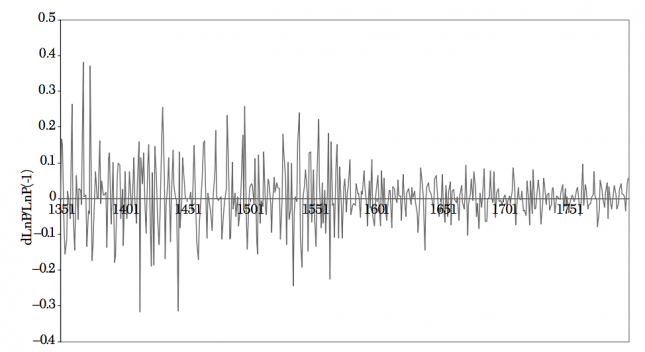
Volatility of the deflator consumer price index (CPI), 1291-2004, measured as the percentage year-on-year change in the CPI – Söderberg (2010)13
Volatility in real wages and in the deflator consumer price index (CPI), 1291–2004, measured as the standard deviation of the percentage year-on-year change – Söderberg (2010)14
| Period | Volatility of real wages | Volatility of deflator CPI |
|---|---|---|
| 1291 - 1399 | 38.1 | |
| 1400 - 99 | 17.8 | |
| 1500 - 99 | 20 | 19.2 |
| 1600 - 99 | 16.4 | 14.7 |
| 1700 - 99 | 13.3 | 12.6 |
| 1800 - 99 | 9.5 | 6.9 |
| 1900 - 2004 | 4.7 | 7 |
Long Run Evidence of the Decrease of Volatility
Recent trends in food price volatility

Per capita food expenditure
In the map shown we see the average per capita food expenditure across select countries, as published by the United States Department for Agriculture (USDA). Food expenditures are measured in US$.
Overall we see large differences in food expenditure across the world. The average Swiss expenditure was $3,631 in 2016 – more than 10 times higher than the average Venezuelan who spent only $258.

Share of expenditure on food
In this chart we see the share of total consumer expenditure spent on food across select countries in 2015. For some countries, food constitutes a large share of expenditure – Nigerians spent 59 percent of total expenditure on food. For others, food constitutes a small share – in the United States, this share was only 6 percent. This relationship is explained by a concept called ‘Engel’s Law’ which we explore here.


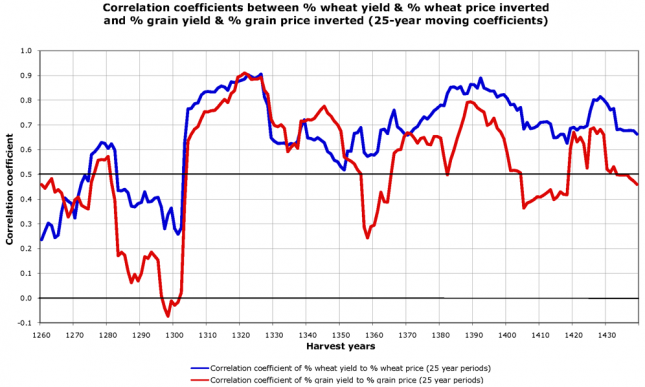
Yields
Correlation coefficients between % yield and % price inverted, 1211-1491 – Campbell17
Food vs. fuel: food and energy prices
In this chart we see the long-term global commodity price index of cereal crops (wheat and corn) alongside the oil price index since 1850. Although not perfectly matched, we see some relationship between the two: increases in oil (energy) prices tend to result in increases in cereal prices.
This relationship may be attributed to two key reasons. Firstly, most modern agricultural and food systems require energy inputs (either in the form of on-farm machinery, transportation, distribution or storage energy). Increases in energy prices can inevitably have an impact of producer and distribution costs, resulting in higher food prices. Studies have suggest that the passthrough of price changes in energy and transport inputs to agricultural commodities to result in a price increase of approximately 15-20 percent.18
The second potential reasoning for this relationship relates to the allocation of crops to biofuels – an important consideration in terms of food security. The rationale follows that a rise in oil prices drive demand in the production of biofuels; this increased diversion of food crops to biofuel production reduces food supplies, resulting in an increase in price. The role of biofuel production on food prices and food security remains strongly contested. Following the rise in food prices over the period 2005-2008, several authors – including the World Bank – attributed the largest driver to be increased biofuel production in the United States and European Union.19
The authors state that the rise in food prices ” the most important factor [in higher food prices] was the large increase in biofuels production in the U.S. and the EU. Without these increases, global wheat and maize stocks would not have declined appreciably, oilseed prices would not have tripled, and price increases due to other factors, such as droughts, would have been more moderate.”
Other studies which assess the relative contributions of different drivers of food prices suggest the price relationship between biofuel and food commodities is more complex. Zilberman et al. (2012) conclude that the introduction of biofuels can affect food prices but this impact various significantly by crop type and location; this effect is less marked when biofuel production is not competing for natural resources with food crops.20
For example, the use of sugarcane ethanol in Brazil or use of non-food crop biofuels (such as miscanthus grasses) are likely to have a smaller impact on food prices relative to cereals such as wheat or corn. The authors also note that the impact of biofuels on food prices can be significant, but less so than other drivers such as economic growth, or the introduction of genetically-modified crops (which have the opposite effect on prices).

Determinants of food price volatility
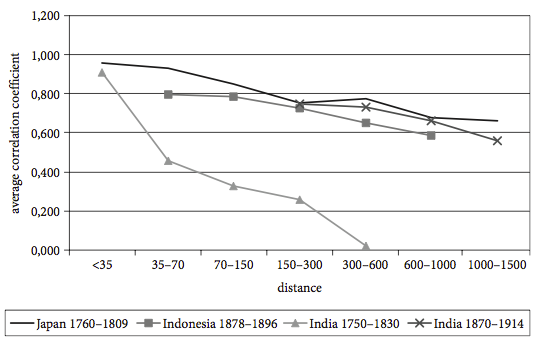
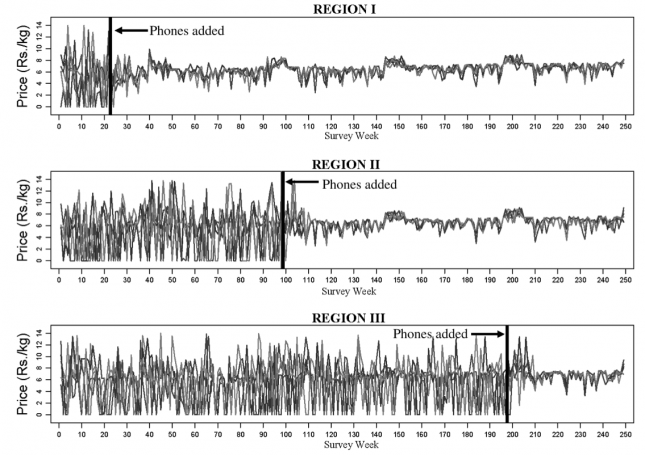
In the first chart here you see two important aspects. Firstly it shows the how the degree to which prices are similar (as measured by the correlation coefficient of prices) decreases as you consider markets at a greater distance from one another. Secondly, you see how in India between 1750-1830 and 1870-1914 the agricultural market became more integrated: price differences between different regions were reduced.
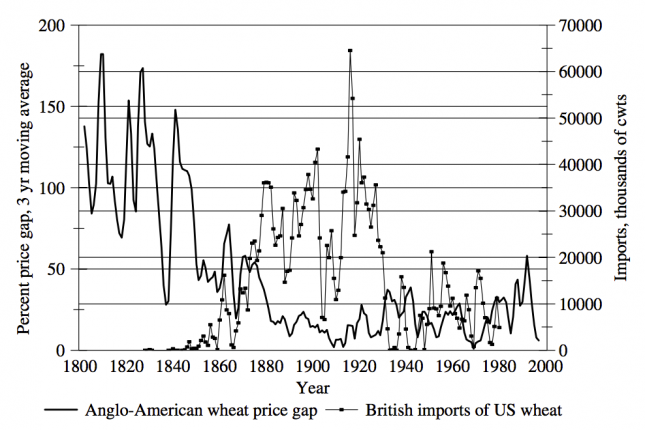
The second chart shows time series for the level of British imports of wheat from the US and the difference between US and British wheat prices. As US imports increased in the late 1800s, the gap between the US and British price for wheat fell.
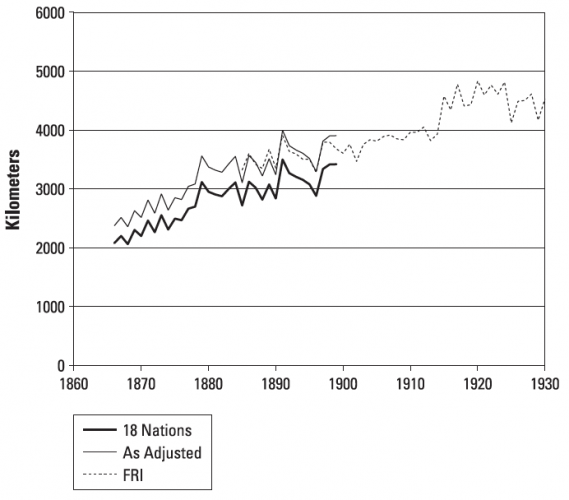
Average distance of world wheat production from London, 1866-1930 – Olmstead & Rhode (2007)23
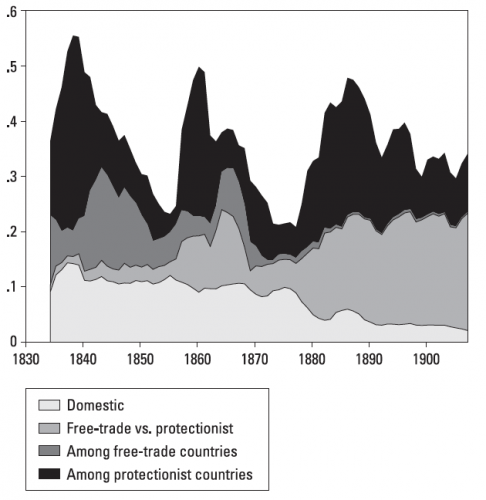
Decomposition of ‘world’ price variance, 1830-1913 – Federico and Persson (2007)26
Determinants of Food Expenditure
In 1857, the economist Ernest Engel wrote: “the poorer a family, the greater the proportion of its total expenditure that must be devoted to the provision of food”, with later extension of this concept to national and global levels.27
This later became known as ‘Engel’s Law’.
‘Engel’s Law’ states that as incomes rise, the proportion of consumer expenditure spent on food falls, even if food expenditure rises in absolute terms. We can see this relationship in these two charts. In the first chart we see the relationship between the share of consumer expenditure spent on food (y-axis) versus gross domestic product (GDP) per capita. Overall we see that countries at lower incomes tend to spend a much higher percentage of expenditure on food; countries with per capita GDP below $5,000 tend to spend more than 30 percent of expenditure on food. Countries at the high end of the income scale tend to spend a much lower share: typically 10-15 percent.
Those at higher incomes tend to spend a lower share of expenditure on food – this is despite the fact that they tend to spend more on food in absolute terms. In the second chart we see total food expenditure (in US$ in 2015) on the y-axis versus GDP per capita. Here we see that as incomes rise we spend more money on food in absolute terms; the average person in Switzerland spends more than 10 times as much on food than the average Indian. However, this is despite the fact that the average Indian spends more than three times as much as a share of total expenditure, as seen in the other chart (the average Indian spends 31 percent of total expenditure on food, versus only 9 percent in Switzerland).
So, as incomes rise we tend to allocate a smaller share of total expenditure on food (and spend it instead on other goods and services) despite spending more on food in absolute terms.


FAO Food Price Index
“The FAO Food Price Index is a measure of the monthly change in international prices of a basket of food commodities. It consists of the average of five commodity group price indices [cereal, vegetable, dairy, meat and sugar], weighted with the average export shares.”28
Historical Statistics on Food Prices
- Data: David Jacks an expert in agricultural history publishes many food price series on his website.
- Geographical coverage: Many countries and regions around the world
- Time span: Some of the series go back to the Middle Ages but most start after 1800.
- Available at: David Jacks personal website here.
- Data: Monthly grain prices
- Geographical coverage: Different places in England
- Time span: 1270-1955
- Available at: The website of the International Institute of Social History here.
Data on Food Prices in Recent Decades
- Data: Food prices of over 200 commodities for primary crops, live animals and livestock – “representing over 97 percent of the world’s value of gross agricultural production” (FAO). Producer prices and producer and consumer price indices.
- Geographical coverage: Over 130 countries.
- Time span: The up-to-now series go back to 1991, whilst the Price Archive contains historical data from 1966 to 1990 (these series are not always comparable). Monthly and annual data.
- Available at: The FAO Food and Agricultural Price Statistics are online here.
- Data: FAO Food Price Index
- Geographical coverage: Global
- Time span: Since 1961
- Available at: the FAO food price level index page.
- Data: Database with over 1170 series of prices of different food commodities
- Geographical coverage: Over 80 countries – often several cities within the same country
- Time span: Some series going back to 1990
- Available at: the FAO here.
- Data: FEWS publishes country-by-country Price Bulletins that provide graphs tracking the prices of commodities that are important locally.
- Geographical coverage: on a small scale level within countries.
- Time span: mostly the recent past.
- Available at: www.fews.net
- FEWS was created in 1985 by the US Agency for International Development (USAID).
- Data: Data on coffee prices, coffee trade, coffee consumption and more is available from the International Coffee Organization (ICO).
- Geographical coverage: Global
- Time span: From 1990 onwards.
- Available at: www.ico.org