Available research shows that social connections are important for our well-being. Having support from family and friends is important for our happiness and health, and is also instrumental to our ability to share information, learn from others, and seize economic opportunities.
In this article we explore data on loneliness and social connections across countries and over time, and review available evidence on how and why social connections and loneliness affect our health and emotional welfare, as well as our material well-being.
Despite the fact that there is a clear link between social connections and well-being, more research is needed to understand causal mechanisms, effect sizes and changes over time.
As we show here, oversimplified narratives that compare loneliness with smoking, or that claim we are living a ‘loneliness epidemic’, are wrong and unhelpful.
Summary
- Social connections matter directly for our happiness and health.
- Social connections are instrumental to prosperity and material well-being.
- Despite the clear link between social connections and well-being, more research is needed to understand causal mechanisms and effect sizes. In particular, more research is needed to pin down the effect that loneliness has on life expectancy.
- Solitary living arrangements are becoming increasingly common around the world, but there is no evidence that self-reported loneliness is increasing over time. This can be explained by the fact that loneliness and aloneness are not the same.
- Social media platforms have transformed social connections around the world.
- The causal effect that social media has on adolescent well-being is likely negative, but it is also likely heterogeneous across the population, and much smaller than newspaper headlines suggest.
Related articles
Interpersonal Trust – Trust is an essential part of social connections. Trust is crucial for community, wellbeing, and effective cooperation.
Internet – For many, the internet is now essential for work, finding information, and connecting with others.
Global Health – Social connections matter for health. In this article we provide an overview of key trends in global health.
Happiness and Life Satisfaction – Social connections matter for our happiness. In this article we provide an overview of key trends in happiness and life satisfaction across societies and locations.
How important are social connections for our health?
Dr. Vivek Murthy, former Surgeon General of the United States, recently wrote: “Loneliness and weak social connections are associated with a reduction in lifespan similar to that caused by smoking 15 cigarettes a day”.
This ‘15 cigarettes a day’ figure has been reproduced and reported in the news many times, under headlines such as “Loneliness is as lethal as smoking 15 cigarettes per day”.1
It is indeed quite a shocking comparison since around 7 million deaths globally are attributed to smoking every year, and back-of-the-envelope calculations published in medical journals say one cigarette reduces your lifespan by 11 minutes.
Here we dig deeper to try to understand what the data and research tell us about the link between social relations and health. In a nutshell, my reading of the evidence is as follows:
- There is a huge amount of evidence showing individuals who report feelings of loneliness are more likely to have health problems later in their life.
- There is credible theory and explanation of biological mechanisms, whereby isolation can set off unconscious surveillance for social threat, producing cognitive biases, reducing sleep and affecting hormones.
- It’s very likely there is a causal link, but there is no credible experimental evidence that would allow us to have a precise estimate of the magnitude of the causal effect that loneliness has on key metrics of health, such as life expectancy.
- The fact that we struggle to pin down the magnitude of the effect of loneliness on health doesn’t mean we should dismiss the available evidence. But it does show that more research is needed.
Measuring loneliness
Psychologists and social neuroscientists often refer to loneliness as painful isolation. The emphasis on painful is there to make a clear distinction between solitude – the state of being alone – and subjective loneliness, which is the distressing feeling that comes from unmet expectations of the types of interpersonal relationships we wish to have.
Researchers use several kinds of data to measure solitude and loneliness. The most common source of data are surveys where people are asked about different aspects of their lives, including whether they live alone, how much time they spend with other people in a given window of time (e.g. ‘last week’) or specific context (e.g. ‘at social events, clubs or places of worship’); and whether they experience feelings of loneliness (e.g. ‘I have no-one with whom I can discuss important matters with’). Researchers sometimes study these survey responses separately, but often they also aggregate them in a composite index.2
Surveys confirm that people respond differently to questions about subjective loneliness and physical social isolation, which suggests people do understand these as two distinct issues.
In the chart here I’ve put together estimates on self-reported feelings of loneliness from various sources. The fact that we see such high levels of loneliness, with substantial divergence across countries, explains why this is an important and active research area. Indeed, there are literally hundreds of papers that have used survey data to explore the link between loneliness, solitude, and health. Below is an overview of what these studies find.
The link between loneliness and physical health
Most papers studying the link between loneliness and health find that both objective solitude (e.g. living alone) and subjective loneliness (e.g. frequent self-reported feelings of loneliness) are correlated with higher morbidity (i.e. illness) and higher mortality (i.e. likelihood of death).
The relationship between health and loneliness can of course go both ways: lonely people may see their health deteriorate with time; but it may also be the case that people who suffer from poor health end up feeling more lonely later down the line.
Because of this two-way relationship it’s important to go beyond cross-sectional correlations and focus on longitudinal studies – these are studies where researchers track the same individuals over time to see if loneliness predicts illness or mortality in the future, after controlling for baseline behaviors and health status.
The evidence from longitudinal studies shows that people who experience loneliness during a period of their life tend to be more likely to have worse health later down the line. In the Netherlands, for example, researchers found that self-reported loneliness among adults aged 55-85 predicted mortality several months later, and this was true after controlling for age, sex, chronic diseases, alcohol use, smoking, self-assessed health condition, and functional limitations.3
Most studies focus either on subjective loneliness, or on objective isolation. But some studies try to compare both. In a recent meta-analysis covering 70 longitudinal studies, the authors write: “We found no differences between measures of objective and subjective social isolation. Results remain consistent across gender, length of follow-up, and world region.” And in the concluding section they highlight that, in their interpretation of the evidence, “the risk associated with social isolation and loneliness is comparable with well-established risk factors for mortality”; which include smoking and obesity.4
The link between mental health and subjective well-being
In another much-cited review of the evidence, Louise Hawkley and John Cacioppo, two leading experts on this topic, concluded that “perhaps the most striking finding in this literature is the breadth of emotional and cognitive processes and outcomes that seem susceptible to the influence of loneliness”.5
Researchers have found that loneliness correlates with subsequent increases in symptoms related to dementia, depression, and many other issues related to mental health; and this holds after controlling for demographic variables, objective social isolation, stress, and baseline levels of cognitive function.
There is also research that suggests a link between loneliness and lower happiness, and we discuss this in more detail here.

Experiments with social animals, like rats, show that induced isolation can lead to a higher risk of death from cancer. Humans and rats are of course very different; but experts, such as Hawkley and Cacioppo, argue that these experiments are important because they tell us something meaningful about a shared biological mechanism. In a review of the evidence, Susan Pinker writes: “If our big brains evolved to interact, loneliness would be an early warning system—a built-in alarm that sent a biological signal to members who had somehow become separated from the group”.6
Indeed, there’s evidence of social regulation of gene expression in humans: studies suggest perceived loneliness can switch on/off genes that regulate our immune systems, and it is this what then affects the health of humans, or other animals that evolved with similar defence mechanisms.7
The bulk of evidence from observational studies and biological mechanisms, described above, implies that loneliness most likely matters for our health and well being. But do we really know how much it matters relative to other important risk factors?
The key point here is that estimates are likely biased to some extent.
The findings from longitudinal studies that track individuals over time are insightful, but they cannot rule out that the relationship might be partly driven by other factors that we cannot observe. Even the studies linking loneliness and genetics can be subject to this omitted-variable bias, because a genetic predisposition to loneliness may drive both loneliness and health outcomes.8
I could not find credible experimental evidence that would allow us to have a precise estimate of the magnitude of the causal effect.9 But the fact that we struggle to pin down the magnitude of the effect doesn’t mean we should dismiss the available evidence. On the contrary – it would be great if we had evidence from randomized control trials that test positive interventions to reduce loneliness, to understand better if the ‘15 cigarettes per day’ comparison from the Surgeon General of the US is roughly correct, at least for the average person.
Having a better understanding of the magnitude of the effect is important, not only because loneliness is common, but also because it’s complex and unequally experienced by people around the world.
As the chart above shows, there are large differences in self-reported loneliness across countries. We should understand how important these differences are for the distribution of health and well-being.
Are we happier when we spend more time with others?
In 1938, a group of Harvard researchers decided to start a research program to track the lives of a group of young men, in what eventually became one of the longest and most famous longitudinal studies of its kind. The idea was to track the development of a group of teenage boys through periodic interviews and medical checkups, with the aim of understanding how their health and well-being evolved as they grew up.10
Today, more than 80 years later, it is one of the longest running research programmes in social science. It is called the Harvard Study of Adult Development and it is still running. The program started with 724 boys, and researchers continue to monitor today the health and well-being of those initial participants who are still alive, most in their late 90s.11
This is a unique scientific exercise – most longitudinal studies do not last this long because too many participants drop out, researchers move on to other projects (or even die), or the funding dries up.
So what have we learned from this unique study?
Robert Waldinger, the current director of the study, summarized – in what is now one of the most viewed TED Talks to date – the findings from decades of research. The main result, he concluded, is that social connections are one of the most important factors for people’s happiness and health. He said: “Those who kept warm relationships got to live longer and happier, and the loners often died earlier”.
Here I take a closer look at the evidence and show more research that finds a consistent link between social connections and happiness. But before we get to the details, let me explain why I think this link is important.
As most people can attest from personal experience, striving for happiness is not easy. In fact, the search for happiness can become a source of unhappiness – there are studies that show actively pursuing happiness can end up decreasing it.
The data shows that income and happiness are clearly related; but we also know from surveys that people often overestimate the impact of income on happiness. Social relations might be the missing link: In rich countries, where minimum material living conditions are often satisfied, people may struggle to become happier because they are targeting material rather than social goals.
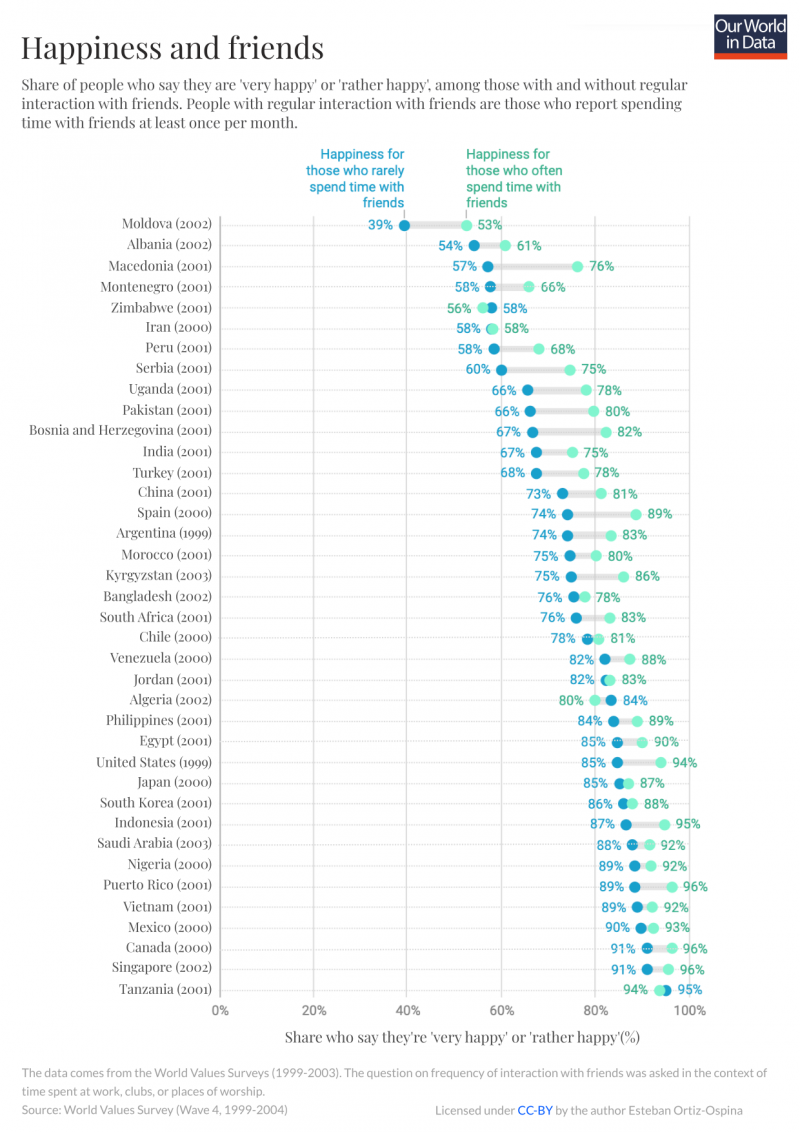
The World Value Survey (WVS) is a large cross-country research project that collects data from a series of representative national surveys. In the fourth wave (1999-2004) the WVS asked respondents hundreds of questions about their lives, including whether they were part of social or religious groups, how often they spent time with friends, and whether they felt happy with their life.
By comparing self-reported happiness among those with and without frequent social interactions, we can get an idea of whether there is indeed a raw correlation between happiness and social relations across different societies.
In the chart below I show this comparison: The green points correspond to happiness among those who interact with friends at least once per month; while the blue dots correspond to happiness among those who interact with friends less often.12
This chart shows that in almost all countries people who often spend time with their friends report to be happier than those who spend less time with friends.13
The chart above gives a cross-sectional perspective – it’s just a snapshot that compares different people at a given point in time. What happens if we look at changes in social relations and happiness over time?
There is a large academic literature in medicine and psychology that shows individuals who report feelings of loneliness are more likely to have health problems later in life (you can read more about this in my post here); and similarly, there are also many studies that show that changes in social relations predict changes in happiness and life satisfaction.
One of the research papers that draws on data from the famous Harvard Study of Adult Development, for example, looked at the experiences of 82 married participants and their spouses, and found that greater self-reported couple attachment predicted lower levels of depression and greater life satisfaction 2.5 years later.14
Other studies with larger population samples have also found a similar cross-temporal link: perceived social isolation predicts subsequent changes in depressive symptoms but not vice versa, and this holds after controlling for demographic variables and stress.15
Searching for happiness is typically an intentional and active pursuit. Is it the case that people tend to become happier when they purposely decide to improve their social relations?
This is a tough empirical question to test; but a recent study found evidence pointing in this direction.
Using a large representative survey in Germany, researchers asked participants to report, in text format, ideas for how they could improve their life satisfaction. Based on these answers, the researchers then investigated which types of ideas predicted changes in life satisfaction one year later.
The researchers found that those who reported socially-engaged strategies (e.g. “I plan to spend more time with friends and family”) often reported improvements in life satisfaction one year later; while those who described other non-social active pursuits (e.g. “I plan to find a better job”) did not report increased life satisfaction.16
From decades of research we know that social relations predict mental well-being over time; and from a recent study we also know that people who actively decide to improve their social relations often report becoming happier. So yes, people are happier when they spend more time with friends.
Does this mean that if we have an exogenous shock to our social relations this will have a permanent negative effect on our happiness?
We can’t really answer this with the available evidence. More research is needed to really understand the causal mechanisms that drive the link between happiness and social relations.17
Despite this, however, I think that we should take the available observational evidence seriously. In a way, the causal impact from a random shock is less interesting than the evidence from active strategies that people might take to improve their happiness. People who get divorced, for example, often report a short-term drop in life satisfaction; but over time they tend to recover and eventually end up being more satisfied with their life than shortly before they divorced (you can read more about this in our entry on happiness and life satisfaction).
It makes sense to consider the possibility that healthy social relationships are a key missing piece for human wellbeing. Among other things, this would help explain the paradoxical result from studies where actively pursuing happiness apparently ends up decreasing it.
The importance of social networks for innovation and productivity
Economies today are increasingly built on ideas. Consider, for example, commercial aviation. After a flight, Southwest Airlines can unload and reload passengers to get the same airliner back in the air in about 10 minutes – this is half the time the same process took in the 1970s. As the economist John Cochrane explains, this achievement is as much about ideas and know-how as it is about technology. Southwest Airlines, and many other carriers after them, have been able to expand their output because they now have more efficient protocols for ‘turning planes’ between flights.
In 2018 Paul Romer won the Nobel Prize in Economics “for integrating technological innovations into long-run macroeconomic analysis”. Romer first fleshed out this observation in his seminal 1990 paper, titled “Endogenous Technological Change”. At the heart of his contributions was precisely this observation: the diffusion of ideas fosters economic and productivity growth.18
Romer’s theory of “endogenous growth” – placing ideas at the heart of economic technologies – made economists ask entirely new questions about the drivers of growth. Where do ideas come from? How do ideas spread?
Economists have asked these questions of the data, and their findings suggest social networks play a key role. Friendship and professional ties matter for economic growth because people tend to develop new ideas by interacting and learning from others who are close to them.
In a nutshell, social networks facilitate the diffusion of ideas across individuals and firms, and because of this, they play an important role in productivity growth. Here’s how this works.
Economic theory suggests we should expect social connections to have an effect on productivity via “knowledge spillovers”.
The basic idea is that social connections make it easier for knowledge to travel farther and faster. Knowledge is different from many physical assets, in that it can be used by many people at the same time; so the diffusion of knowledge creates productivity gains that spillover through society. As Thomas Jefferson once said: “He who receives an idea from me, receives instruction himself without lessening mine; as he who lights his taper at mine, receives light without darkening me”.19
What is the empirical value of this theory? What do ‘knowledge spillovers’ actually look like in the real world? Do scientists and engineers really rely on social connections to disseminate their new ideas and inventions?
To answer these questions economists have looked into historical data from patents.
Patents are government licences used to register the intellectual property of new inventions, ranging from machines to medical drugs. When a patent application is filed, inventors are required to include a list of citations, in which they describe how their technological development builds upon the results of earlier patents. These historical records of patent citations give us an overview of how knowledge flows – patent citations are the ‘paper trail’ left by ideas as they travel, evolve, and make new ideas possible.
One of the first analyses of patent citations in the context of knowledge spillovers was done by Adam Jaffe, Manuel Trajtenberg and Rebecca Henderson, in a much-cited paper published in the Quarterly Journal of Economics in 1993.20
Jaffe and coauthors studied, in particular, the geographic distribution of citation patterns in the US.
If social connections did not matter for new ideas and growth, then we should expect that new inventions are just as likely to cite patents from far away as they are to cite the work of their neighbours. In contrast, Jaffe and coauthors found that new patents were disproportionately more likely to cite previous local patents. In other words, they found that patent citations were strongly geographically concentrated. According to their estimates, citations were three to four times as likely to come from the same state as the originating patent – this is consistent with the idea that social connections and proximity do indeed matter for innovation.
After this initial study, several other papers have used patent citations to explore the determinants of knowledge spillovers, with a broader perspective on ‘proximity’.
Ajay Agrawal, Devesh Kapur and John McHale used the ethnicity of researchers as a proxy for social connectedness, and found that co-location and co-ethnicity both increase the probability of knowledge flow between inventors. Co-location increases the probability of a knowledge flow by 24% (assuming non-co-ethnic inventors) and co-ethnicity increases the probability by 14% (assuming non-co-located inventors). Again, these large concentration patterns seem consistent with the idea that proximity and social networks matter for innovation.21
The correlation between proximity and patent citations partly captures the effect that local factors may have on innovation (e.g. geography, regulation or infrastructure around industry hubs where similar workers and firms concentrate). However, the evidence shows that social connections matter for the transmission of knowledge even after we control for these other factors.
In a paper published in 2018 in the Journal of Economic Perspectives, Michael Bailey, Rachel Cao, Theresa Kuchler, Johannes Stroebel, and Arlene Wong combined patent records with Facebook data from the US, and found that social connectedness between US counties (measured by the frequency of Facebook ties between counties) predicts the probability of cross-county patent citations. This is true, even after accounting for the patents’ technology class and geographic distance between counties.22
This means that the probability that an inventor builds on the work of another inventor in a different part of the country can be partly explained by how well-connected their social backgrounds are, even after controlling for geographic distance and other demographic factors.23
The implications of this result are of great consequence in the age of the internet. The development of new communication-enabling technologies, such as the rise of social media, have opened new possibilities for creating and maintaining social connections, and this is likely to have had a positive effect on the transmission of knowledge.
Globally, the total economic output per person today is 4.4-times larger than in 1950 (even after accounting for inflation). This was achieved over a period during which people tended towards working fewer hours. We now produce more whilst working less.
As our interactive chart here shows, this historical achievement is underpinned by productivity growth: in many countries, workers produce much higher output per hour today than in 1950.
This is partly because of new machines and technologies, but also because we have new shared knowledge about how to work more efficiently.
The research on social connections and innovation suggests that one important way to improve material living standards is to invest in digital communication technologies. This lowers the costs of creating and maintaining personal and professional ties, which facilitates the diffusion of ideas and knowledge, creating positive productivity spillovers.

Technical Note:
The importance of personal relations for economic outcomes
After the fall of the Berlin Wall in 1989, West German families that had relatives in East Germany saw an increase in their income, and this growth in incomes was significantly higher than that of comparable West German families without such family ties to the East.
Why did this happen? Are personal and family ties really so important to our economic outcomes that they result in systematic differences in income growth?
Researchers have studied this question and have found empirical support for the idea that social connections do, indeed, have large effects on economic outcomes.
Measuring the impact of personal relations on economic outcomes is difficult. This is because these two aspects of our life are often closely intertwined – social ties facilitate economic interactions, but at the same time people with whom we interact for economic reasons end up becoming acquaintances or even friends.
To overcome this difficulty, the economists Konrad Burchardi and Tarek Hassan studied a historical event that suddenly opened up new economic interactions, where previously only non-economic social connections were possible: The fall of the Berlin Wall.24
For decades private economic exchange between East and West Germany was virtually impossible, but at the same time people on both sides maintained social ties for non-economic reasons. After the fall of the Berlin Wall in 1989, trade and collaboration between the two Germanies suddenly became feasible. Burchardi and Hassan studied the impact that this sudden change had on household incomes.
After the fall of the Berlin Wall in 1989 there was growth in incomes across Germany as a whole; but the interesting finding from Burchardi and Hassan is that income growth for households in West Germany who had ties to at least one relative in the East was much higher – six percentage points higher – than that of comparable households without such ties.
Burchardi and Hassan argue that West German households that had ties to East Germany had a comparative advantage in seizing the new economic opportunities in the East. Having personal relationships with East Germans gave them access to valuable economic information – information regarding local demand conditions, and about the quality of East German assets that were offered to investors.
These gains from social connections actually added up at the regional level. West German regions that had a higher concentration of households with social ties to the East, enjoyed substantially higher growth in incomes in the early 1990s. A one standard deviation rise in the share of households with social ties to East Germany in 1989 was associated with a 4.6 percentage point rise in income per capita over six years.
The unique situation of the German reunification shows that social ties that are initially unrelated to economic interests can become important for economic success.
The key mechanism is that personal connections allow us to seize new economic opportunities. This may sound abstract, but in fact most of us have experienced this in our own lives. Perhaps the best example is job searching: personal contacts and connections are one of the most common ways for people to find a job.
In the book The Human Network, the economist Matthew Jackson draws on decades of research to help explain how social connections affect power, beliefs and behaviors. With regard to job networks and social capital, he writes: “If you have ever struggled to find a job, you are not alone. Without well-connected friends or family it is hard to make it in any industry […]. Finding a job without having some personal connection to someone already employed at a firm is more the exception than the rule.” 25
Our interactive chart here shows evidence for Jackson’s claim using data from European countries.
The chart shows the distribution of job search methods by country. Data for Spain is shown by default, but you can explore data for different countries using the option ‘Change country’.
In Spain, 84% of the unemployed rely on contacts – friends, relatives, trade unions – to find a job. It is the most common job-search method. Direct applications and ads rank below, on places two and three.
If you plot the same data for other countries you’ll see that personal contacts are a very important job-search method everywhere in Europe, but there is some variation across countries. At the lowest end of the spectrum, in Belgium, about 38% of people rely on contacts to find a job; at the other end, in Greece and Latvia, 90% of job seekers rely on this method.
(NB. This interactive map shows the same data, but focusing specifically on the proportion of job seekers relying on contacts for job search across Europe.)

The chart showing job search methods across Europe relies on data from the European Labor Force Survey, 2006-2008. We have not found more recent data that allows cross-country comparisons, but surveys from individual high-income countries show that this remains relevant today, even after the expansion of online job search engines, and the rise of social media platforms.
In the US, data from the Pew Research Center shows that the internet is the most important resource for job search, but 66% of survey respondents still say they relied on connections with close friends or family in their most recent search for a job.
These two methods are of course not mutually exclusive, and the boundaries between ‘internet’ and ‘personal contact’ are becoming less clear as job search platforms become more integrated with social media.

Personal relations can also provide information and social collateral that can be valuable for economic interactions across national borders.
The political scientist Anna Lee Saxenian analyzed the biographies of Chinese and Indian engineers who migrated to California in the 1970s. She found that as these skilled immigrants excelled in their personal careers, they started leveraging their social ties to relatives and friends in their home regions. This allowed them to outsource important operations for a large fraction of Silicon Valley firms.26
Saxenian argues that by connecting Silicon Valley firms to low-cost, high-quality labor in India and China, they became instrumental for the success of Silicon Valley and crucial in the emergence of their home regions as major hubs of the global IT services industry.
In some situations personal connections may facilitate economic transactions for one person (or group of people) at the expense of another one. This is what many people have in mind when they think about job referrals. If there is only one job vacancy, giving the job to a friend means not giving the job to someone else. If social connections become a vehicle for favouritism, this can lead to inefficiencies.
In many contexts, however, the opposite is true. Social connections often have a net-positive effect on aggregate economic outcomes because much of the impact of social connections on economic transactions is not zero-sum – for example, when social connections reduce information frictions and allow people to learn from each other. As we discuss in a companion post, there is empirical evidence showing these knowledge spillovers are substantial.
The concentration of firms and workers in ‘industry hubs’ is partly explained by the fact that social connections create economic externalities: Agglomeration leads to denser social connections, and this has positive spillover effects on productivity.
Again the fall of the Berlin Wall offers clear evidence of this.
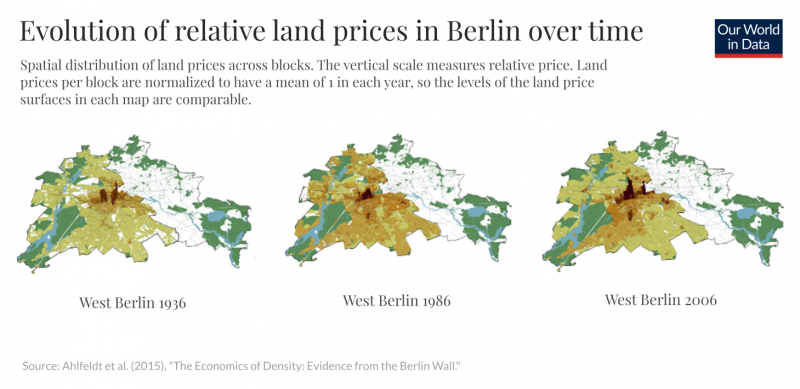
When Berlin was split, economic activity in West Berlin shifted away from the historic business district, known as ‘Mitte’. As a consequence property prices there fell relative to the new economic areas that emerged further away from the Wall.
When the Wall came down the distribution of economic activity within the city changed quickly once again: The old business district began to re-emerge and economic activity shifted back to the historic center. This is the conclusion of a careful econometric study, published by Gabriel Ahlfeldt, Stephen Redding, Daniel Sturm and Nikolaus Wolf in the journal Econometrica.27
The three maps show the evolution of land prices in Berlin. These maps, from Ahlfeldt and co-authors, illustrate graphically the impact that the Wall had on the geography of economic activity. The vertical scale measures relative land prices; this means higher elevation, highlighted with darker shades, denotes higher prices.28
The map on the left shows that in 1936 there are two areas with very high land values in West Berlin and both are close to the center (they are both part of a concentric ring around the pre-war central business district, located in the middle).
In 1986, we see smaller peak values; in fact, we see that the pre-war peak closest to the Wall is entirely eliminated following division, as this area ceased to be an important center of commercial and retail activity.
Finally, in 2006, we see again higher peaks; and we see that the area closest to the Wall is reemerging as a center of high land values.
This evolution is a great example of the economics of density: The areas in West Berlin close to the old central business district became less productive during the division but regained their productivity and attractiveness again soon after reunification.
Knowledge, public resources, and opportunities for trade and collaboration that had been inaccessible for decades, suddenly became available after the fall of the Wall.29
Social connections matter hugely for economic outcomes. Personal relations, even those that we maintain for non-economic reasons, often give us access to information and provide us with social collateral for economic transactions – from buying a house to getting a job.
This can have positive consequences that extend beyond the individuals directly involved in the transactions. When personal and professional ties facilitate the exchange of information and knowledge, this can bring benefits to society as a whole. The implication from this is that social connections are not only important because they affect our emotional well-being, but also because, as we show here, they affect our material well-being too.
Living alone is becoming increasingly common around the world
In the US, the share of adults who live alone nearly doubled over the last 50 years. This is not only happening in the US: single-person households have become increasingly common in many countries across the world, from Angola to Japan.
Historical records show that this ‘rise of living alone’ started in early-industrialized countries over a century ago, accelerating around 1950. In countries such as Norway and Sweden, single-person households were rare a century ago, but today they account for nearly half of all households. In some cities they are already the majority.
Surveys and census data from recent decades show that people are more likely to live alone in rich countries, and the prevalence of single-person households is unprecedented historically.
Social connections – including contact with friends and family – are important for our health and emotional well-being. Hence, as single-person households become more common, there will be new challenges to connect and provide support to those living alone, particularly in poorer countries where welfare states are weaker.
But it’s important to keep things in perspective. It’s unhelpful to compare the rise of living alone with a ‘loneliness epidemic’, which is what newspaper articles often write in alarming headlines.
Loneliness and solitude are not the same, and the evidence suggests that self-reported loneliness has not been growing in recent decades.
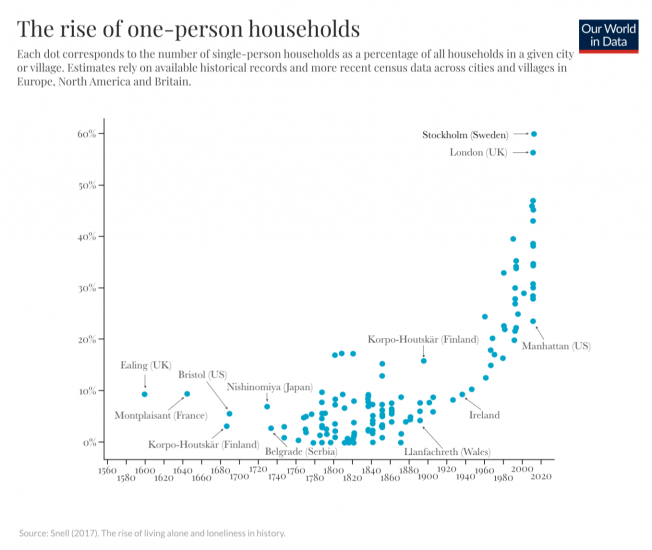
Historical records of inhabitants across villages and cities in today’s rich countries give us insights into how uncommon it was for people to live alone in the past.
The chart here, adapted from a paper by the historian Keith Snell, shows estimates of the share of single-person households across different places and times, using a selection of the available historical records and more recent census data. Each dot corresponds to an estimate for one settlement in Europe, North America, Japan or Britain.30
The share of one-person households remained fairly steady between the early modern period and through the 19th century – typically below 10%. Then growth started in the twentieth century, accelerating in the 1960s.
The current prevalence of one-person households is unprecedented historically. The highest point recorded in this chart corresponds to Stockholm, in 2012, where 60% of households consist of one person.
For recent decades, census data can be combined with data from large cross-country surveys, to provide a global perspective on the proportion of households with only one member (i.e. the proportion of single-person households). This gives us a proxy for the prevalence of solitary living arrangements.31
We produced this chart combining individual reports from statistical country offices, cross-country surveys such as the Demographic and Health Surveys, and estimates published in the EU’s Eurostat, the UN’s Demographic Year Books, and the Deutschland in Daten dataset.
The chart shows that the trend of rising single-person households extends across all world regions. There are large differences between countries – from more than 40% in northern European countries to 1% in low-income Asian countries.
(NB. For the US and Canada there are long-run time series from census data that let us directly track the share of people who live alone. This is shown in this other chart, where you can see the same trend.)

National income per capita and the share of one-person households are strongly correlated: As the chart here shows, people are more likely to live alone in rich countries.
In this interactive chart you can move the slider to see changes over time. This reveals that the rise of single-person households tends to be larger in countries where GDP per capita has grown more. (NB. You can also see the correlation over time in this other scatter plot comparing average growth in GDP vs average growth in one-person households).
These correlations are partly due to the fact that people who can afford to, often choose to live alone. Indeed, rising incomes in many countries are likely part of the reason why people are more likely to live alone today than in the past.
But there must be more to it since even at the same level of incomes there are clear differences between regions. In particular, Asian countries have systematically fewer one-person households than African countries with comparable GDP levels. Ghana and Pakistan, for example, have similar GDP per capita, but in Pakistan one-person households are extremely rare, while in Ghana they are common (about 1 in 4). This suggests culture and country-specific factors also play an important role.
Additionally, there are other non-cultural country-specific factors that are likely to play a role. In particular, rich countries often have more extensive social support networks, so people in these countries find it easier to take risks. Living alone is more risky in poorer countries, because there’s often less supply of services and infrastructure to support more solitary living arrangements.
And finally, it’s also likely that some of the causality runs in the opposite direction. It’s not only that incomes, culture or welfare states enable people to live alone, but also that for many workers attaining higher incomes in today’s economy often demands changes in living arrangements. Migration from rural to urban areas is the prime example.

Social connections – including contact with friends and family – are important for our health and emotional well-being. Hence, as the ‘rise of living alone’ continues, there will be new challenges to connect people and provide support to those living alone, particularly in poorer countries where communication technologies are less developed and welfare states are weaker.
But, it’s also important to keep in mind that living alone is not the same as feeling lonely. There’s evidence that living alone is, by itself, a poor predictor of loneliness. Self-reported loneliness has not been growing in recent decades, and in fact, the countries where people are most likely to say they have support from family and friends, are the same countries – in Scandinavia – where a large fraction of the population lives alone.
Incomes and freedom of choice are not the only drivers of the ‘rise of living alone’; but it would be remiss to ignore they do contribute to this trend.
Higher incomes, economic transitions that enable migration from agriculture in rural areas into manufacturing and services in cities, and rising female participation in labor markets all play a role. People are more likely to live alone today than in the past partly because they are increasingly able to do so.
Loneliness and aloneness are not the same
There is a popular perception that countries in Northern Europe are heavily individualistic and because of this people in these societies tend to be much lonelier. The data, however, does not support this claim.
What is true is that in countries such as Denmark and Switzerland, it is very common for people to live alone. But contrary to what many believe, this does not translate into higher levels of self-reported loneliness.
Below we discuss the data in more detail, and show that this can be partly explained by the fact that loneliness and aloneness are just not the same. Both loneliness and solitude deserve attention, but it’s important not to conflate them.
Loneliness describes a subjective feeling; this is conceptually distinct from objective physical isolation.
In the chart here we show estimates on self-reported feelings of loneliness among older adults. The data comes from various surveys asking people directly whether they often experience feelings of loneliness (e.g. “I have no-one with whom I can discuss important matters with”).
The differences in the prevalence of loneliness across countries are very large. At the bottom of the list, Denmark, Switzerland, Sweden and the US all have rates below 30%, while at the top of the list Greece, Israel and Italy all have rates of close to or above 50%.
The data is available only for fifteen countries, but this sample does not suggest that ‘rich individualistic societies’ are lonelier than others. In fact, at the very bottom are two countries in which the share of people living alone is among the highest in the world.
Similar to loneliness, we can measure perceptions of social support by asking people directly. This is what the polling organization Gallup did in their flagship World Poll survey. Specifically, they asked: “If you were in trouble, do you have relatives or friends you can count on to help you whenever you need them, or not?”
The chart here presents the results from this survey, plotting the share of people who responded “yes” to this question.32
Differences across countries are not very large. The lowest and highest average levels of support corresponds to Mexico and Iceland, at 80% and 98% respectively.
The second point that stands out is that, again, there’s no support for the claim that richer countries that are considered to be more individualistic (e.g. North European countries) have lower levels of family and friendship support.

Are people who live alone more likely to say they feel lonely?
The researchers Caitlin Coyle and Elizabeth Dugan explored this question using data from the Health and Retirement Study in the US. In their analysis, covering almost 12,000 respondents over the years 2006-2008, they found that loneliness and social isolation are not highly correlated at the individual level.33
To be precise, Coyle and Dugan found a correlation coefficient of 0.2. That means the correlation is positive, and it is statistically larger than zero; but it’s not very large in absolute terms. Their study does not provide the raw data, but in general, a scatter plot with correlation 0.2 is pretty much just a cloud of dots.
This means you cannot predict much of the variability in loneliness from observed differences in living arrangements. Some people who live alone are lonely, but many are not. Concluding that someone who lives alone must feel lonely is very often wrong.34
People do not seem to be more lonely in societies that are traditionally labeled as ‘individualistic’.
What is true is that in these societies it is particularly common for people to live alone. But being alone and feeling lonely don’t always go hand in hand. Many people feel lonely even if they are not physically isolated; and many people who are physically isolated do not feel lonely.
The aggregate statistics confirm this. Surveys that ask people about living arrangements, time use, and feelings of loneliness, find that solitude, by itself, does not predict feelings of loneliness.
The fact that people in individualistic countries are not more likely to feel lonely may of course capture differences in expectations regarding social relations. But to the extent that loneliness is a subjective experience, these cross-country differences are still important to understand well-being.
Both loneliness and solitude deserve attention, but it’s important not to conflate them.
Changes in loneliness over time: Is there a loneliness epidemic?
The media seems to have agreed that rich countries are experiencing a ‘loneliness epidemic’. There are literally thousands of newspaper articles that use this exact expression.
What is the evidence for this? The word ‘epidemic’ suggests that things are getting much worse and loneliness is increasing rapidly. But does the data in fact show that societies are becoming lonelier?
Despite the popularity of the claim, there is surprisingly no empirical support for the fact that loneliness is increasing, let alone spreading at epidemic rates.
It is true that more people are living alone around the world. But loneliness and aloneness are not the same. As we explain in a companion post, spending time alone is not a good predictor of whether people feel lonely, or have weaker social support.
As we explain later, today’s adolescents in the US do not seem to be more likely to report feeling lonely than adolescents from a couple of decades ago; and similarly, today’s older adults in the US do not report higher loneliness than older adults in the past. Surveys covering older adults in other rich countries, including Finland, Germany, England and Sweden, point in the same direction – it’s not the case that loneliness is increasing across generations in these countries.35
Social connections – including contact with friends and family – are important for our health and emotional welfare, as well as for our material well-being. Loneliness is indeed an important problem, but it’s crucial to have a nuanced conversation based on facts. The headlines that claim we are witnessing a ‘loneliness epidemic’ are wrong and unhelpful.
One statistic that is often used to argue that loneliness is increasing, is that young people today are lonelier than older adults. This begs two questions: (i) Is it true that younger people are lonelier, and (ii) does this show that loneliness is increasing?
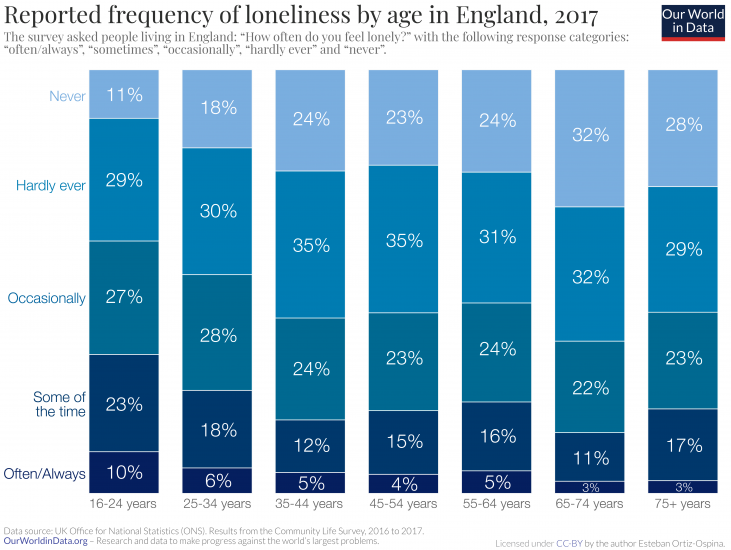
Let’s start with the first question. In England, the Office for National Statistics conducts the Community Life Survey, in which they ask people how often they feel lonely. In the bar chart here we show a breakdown of self-reported loneliness by age group.
According to this data, those aged 16 to 24 are the group most likely to report feeling lonely, with 10% feeling lonely “often or always”. In contrast, those aged 65 years and older are the group least likely to report feeling lonely, with 3% feeling lonely “often or always”.
Many people tend to associate loneliness with older age, so this pattern might seem surprising. But surveys from several other rich countries have found the same. In New Zealand, Japan and the US, young adults also report feeling lonely more often than older adults.
So, yes, in rich countries we find that younger people are more likely to report feeling lonely.36
What about the second question? Does this mean that loneliness is increasing?
Here, the answer is ‘no’. Cross-sectional comparisons are not informative about changes over time, because loneliness is not constant across the life cycle. To be able to say something meaningful about changes in loneliness over time, we need to distinguish between changes for individuals over time (do people become lonelier as they get older?) and changes across generations (are people of the same age lonelier today than in the past?).
Let’s dig deeper and explore these questions separately.
To understand how loneliness changes across our life cycle, we need loneliness data from surveys that track the same individuals over time, up until old age. In a study published in the journal Psychology and Aging, Louise Hawkley and co-authors examine two such surveys, with data for adults older than 50 years in the US.37
They found that after age 50 – which is the earliest age of participants in their study – loneliness tended to decrease, until about 75, after which it began to increase again.
The authors explain in their paper that the increase in loneliness after 75 was explained by a decline in health and the loss of a spouse or partner. When adjusting for these factors, they found that loneliness continued declining into ‘oldest old age’.
This shows that there are two forces at play. On the one hand, there seems to be a direct relationship between age and loneliness, whereby loneliness decreases with age as our social expectations adapt, and we become more selective about relating with contacts who bring positive emotions. On the other hand, there seems to be an indirect association pushing in the opposite direction, whereby loneliness increases with age, because our health deteriorates and we lose relatives and friends.
In our middle age the direct effect dominates, but once we enter advanced old age, the negative indirect effect starts dominating.
This complex relationship between age and loneliness shows why comparing old and young people at a given point in time is misleading. Cross-sectional comparisons are just not informative about the evolution of loneliness over time, because loneliness is not constant across the life cycle.
In the ‘loneliness epidemic’ narrative, it is often implied that if we compare two individuals of the same age – one today and another one a generation ago – we would find that the one today is more likely to feel lonely. This is based on the idea that there have been societal changes – such as the rise of living alone – that make newer generations more likely to feel lonely.
In their study, Louise Hawkley and co-authors searched for evidence of these ‘cohort trends’ in the US, but didn’t find any. There was very little difference in self-reported loneliness of people born in different generations. Those that were born in 1920-1947 experienced the same changes of loneliness throughout their lives as those born in 1948-1965. It’s not the case that loneliness is increasing across generations.
An article by Tom Chievers explains this result from the study very well: “[Hawkley and co-authors] found that “newer” old people (baby boomers born 1948-1965) are no more likely to think of themselves as lonely than “older” old people (born 1920-1947), and that older people have not become more likely to think of themselves as lonely in the last decade (2005 – 2016)… The average older person appears to be no more likely to be lonely than they were a decade ago.”
There are studies with data from other rich countries pointing in the same direction. In Sweden, repeated cross-sectional surveys with adults aged 85, 90, and 95 years old, found no increase in loneliness over a ten-year interval.38
These studies find no evidence of cohort effects across older adults. What about evidence for adolescents?
In the aptly titled paper “Rethinking ‘Generation Me’: A Study of Cohort Effects from 1976-2006”, the psychologists Kali Trzesniewski and Brent Donnellan used repeated cohort surveys to explore whether successive groups of high-school graduates were becoming more lonely in the US. They also found no evidence of cohort trends. Newer generations of high-school seniors were not more likely to report feelings of loneliness than earlier generations.39
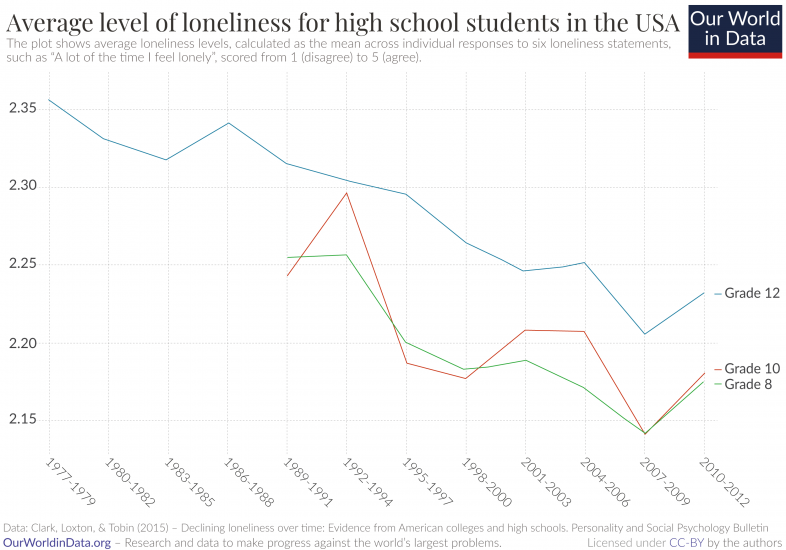
The psychologists Matthew Clark, Natalie Loxton, and Stephanie Tobin replicated this analysis, using the same survey, but focusing on all age groups, not only high-school seniors. The chart here shows their results. They found no signs of increasing loneliness across all age groups. In fact, they found a very small but statistically significant decline in loneliness for high school students in the US.40
(NB. The vertical axis in this chart is truncated, following the presentation in the original paper. The truncated axis is helpful to highlight the trend; but the takeaway is that the changes in levels are extremely small, so the trend is effectively flat in absolute terms, even if the slope is statistically different from zero).
The magazine The Economist wrote an article in 2018 with the title “Loneliness is a serious public-health problem”. In one key paragraph, the article reads: “Historical data about loneliness are scant. But isolation does seem to be increasing, so loneliness may be too.”
The data we have found shows that this reasoning is actually incorrect.
Surveys from rich countries do not suggest there has been an increase in loneliness over time. Today’s adolescents in the US do not seem to be more likely to report feeling lonely than adolescents from a couple of decades ago; and similarly, today’s older adults in the US do not report higher loneliness than did adults of their age in the past.
That’s of course not to say we should not pay attention to these topics.
It’s important to provide support to people who suffer from loneliness, just as it is important to pay attention to the policy challenges that come from large societal changes such as the rise of living alone. However, inaccurate, over-simplified narratives are unhelpful to really understand these complex challenges.
There is an epidemic of headlines that claim we are experiencing a “loneliness epidemic”, but there is no empirical support for the fact that loneliness is increasing, let alone spreading at epidemic rates.
The rise of social media platforms
Facebook, the largest social media platform in the world, has 2.4 billion users. Other social media platforms including Youtube and Whatsapp also have more than one billion users each.
These numbers are huge – there are 7.7 billion people in the world, with 3.5 billion of us online. This means social media platforms are used by one-in-three people in the world, and more than two-thirds of all internet users.
Social media has changed the world. The rapid and vast adoption of these technologies is changing how we find partners, how we access information from the news, and how we organize to demand political change.
Who uses social media? When did the rise of social media start and what are the largest sites today? Here we answer these and other key questions to understand social media use around the world.
We begin with an outline of key trends and conclude with a perspective on the rate of adoption of social media relative to other modern communication technologies.
The first social media site to reach a million monthly active users was MySpace – it achieved this milestone around 2004. This is arguably the beginning of social media as we know it.41
In the interactive chart we plot monthly active users, by platform, since 2004. You can use the slider to focus on particular years, and you can click the ‘+ Add’ option to change series and track the evolution of other social media platforms.
This chart shows that there are some large social media sites that have been around for ten or more years, such as Facebook, YouTube and Reddit; but other large sites are much newer.
TikTok, for example, launched in September 2016 and by mid-2018 it had already reached half a billion users. To put this in perspective: TikTok gained on average about 20 million new users per month over this period.
The data also shows rapid changes in the opposite direction. Once-dominant platforms have disappeared. In 2008, Hi5, MySpace and Friendster were close competitors to Facebook, yet by 2012 they had virtually no share of the market. The case of MySpace is remarkable considering that in 2006 it temporarily surpassed Google as the most visited website in the US.
Most of the social media platforms that survived the last decade have shifted significantly in what they offer users. Twitter, for example, didn’t allow users to upload videos or images in the beginning. Since 2011 this is possible and today more than 50% of the content viewed on Twitter includes images and videos.

With 2.3 billion users, Facebook is the most popular social media platform today. YouTube, Instagram and WeChat follow, with more than a billion users. Tumblr and TikTok come next, with over half a billion users.
The bar chart here shows a ranking of the top social media platforms, year by year. You can drag the slider in this chart to see the ranking for other years.

The aggregate numbers mask a great deal of heterogeneity across platforms – some social media sites are much more popular than others among specific population groups.
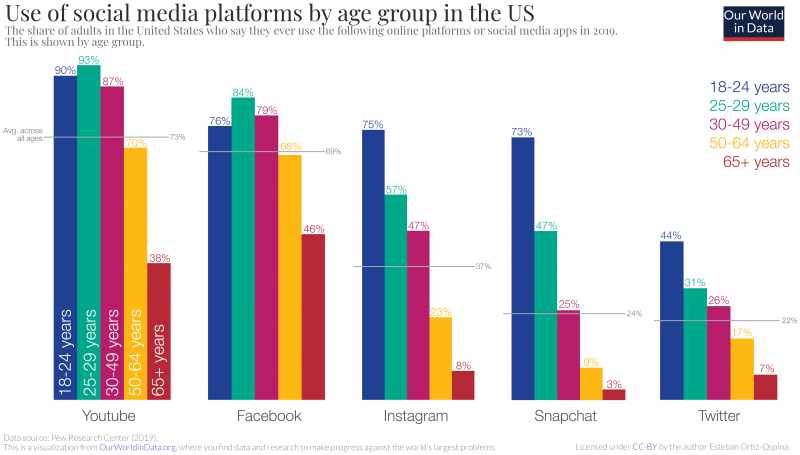
In general, young people are more likely to use social media than older people. But some platforms are much more popular among younger people. This is shown in this chart, where we plot the breakdown of social media use by age groups in the US.
For Snapchat and Instagram the ‘age gradient’ is extremely steep – the popularity of these platforms drops much faster with age. The majority of people under 25 use Snapchat (73%), while only 3% of people over 65 use it.
Since these platforms are relatively new, it’s hard to know how much of this age gradient is the result of a “cohort effect”. In other words: it’s unclear whether today’s young people will continue using Snapchat as they become older. If they do, the age gradient would narrow.
Let’s now look at gender differences.
This chart shows the percentage of men and women who use different platforms in the US. The diagonal line marks parity; so sites above the diagonal line are those more popular among men and sites below are those more popular among women. (Bubble sizes are proportional to the total number of users of each platform.)
For some platforms the gender differences are very large. The share of women who use Pinterest is more than twice as high as the share of men using this platform. For Reddit it is the other way around, the share of men is almost twice as high.

From a back-of-the-envelope calculation we know that, if Facebook has 2.3 billion users, then at least 30% of the world uses social media.42 This is of course just an average – for some world regions, and specifically for some population groups, usage rates are much higher.
Young people tend to use social media more frequently. In fact, in rich countries, where access to the internet is nearly universal, the vast majority of young adults use it.
The chart here shows the proportion of people aged 16 to 24 who use social networks across a selection of countries. As we can see, the average for the OECD is close to 90%.
If today’s young adults continue using social media throughout their life, then it’s likely that social media will continue growing rapidly as internet adoption expands throughout lower-income countries.

The increase in social media use over the last decade has, of course, come together with a large increase in the amount of time that people spend online.
In the US, adults spend more than 6 hours per day on digital media (apps and websites accessed through mobile phones, tablets, computers and other connected devices such as game consoles). As the chart here shows, this growth has been driven almost entirely by additional time spent on smartphones and tablets.43

According to a survey from the Pew Research Center, adults aged 18 to 29 in the US are more likely to get news indirectly via social media than directly from print newspapers or news sites; and they also report being online ‘almost constantly’.44
There is evidence that in other rich countries people also spend many hours per day online. This chart shows the number of hours young people spend on the internet across a selection of rich countries. As we can see, the average for the OECD is more than 4 hours per day, and in some countries the average is above 6 hours per day.

The percentage of US adults who use social media increased from 5% in 2005 to 79% in 2019. Even on a global stage the speed of diffusion is striking: Facebook surged from covering around 1.5% of the world population in 2008, to around 30% in 2018.45
How does this compare to the diffusion of other communication technologies that make part of our everyday life today?
The following chart provides some perspective.
Social media’s growth in the US is comparable – in speed and to some extent also in reach – to that of most modern communication-enabling technologies, including computers, smartphones and the internet.
The rise of social media is an extraordinary example of how quickly and drastically social behaviours can change: Something that is today part of the everyday life of one-third of the world population, was unthinkable less than a generation ago.
Fast changes like those brought about by social media always spark fears about possible negative effects. Specifically in the context of social media, a key question is whether these new communication technologies are having a negative impact on our mental health – this is an important question and we cover the evidence at Our World in Data here.

Are Facebook and other social media platforms bad for our well-being?
Facebook, Youtube, Whatsapp, WeChat, and Instagram are the top five social media platforms globally, with over one billion active users each. In most rich countries the proportion of young people using online social networks exceeds 90% and teens spend on average more than 4 hours online every day.
We’re repeatedly told in the news that social media is bad for us. The stories are often alarming, suggesting social media and smartphones are responsible for sweeping negative trends, from rising suicide rates in the US, to widespread loss in memory, and reduced sleep and attention spans.
These worrying headlines often go together with implicit or explicit recommendations to limit the amount of time we spend on social media. Indeed, smartphones today come with built-in “screen time” apps that let us track and limit how much time we spend online.
At the same time, most of us would agree that digital social media platforms can make our lives easier in many ways – opening doors to new information, connecting us with people who are far away, and helping us to be more flexible with work.
What does the research tell us about the causal impact of social media use on our well-being?
In a nutshell: From my reading of the scientific literature, I do not believe that the available evidence today supports the sweeping newspaper headlines.
Yes, there is evidence suggesting a causal negative effect, but the size of these causal effects is heterogeneous and much, much smaller than the news headlines suggest.
There are still plenty of good reasons to reflect on the impact of social media in society, and there is much we can all learn to make better use of these complex digital platforms. But this requires going beyond universal claims.
Let’s take a look at the evidence.
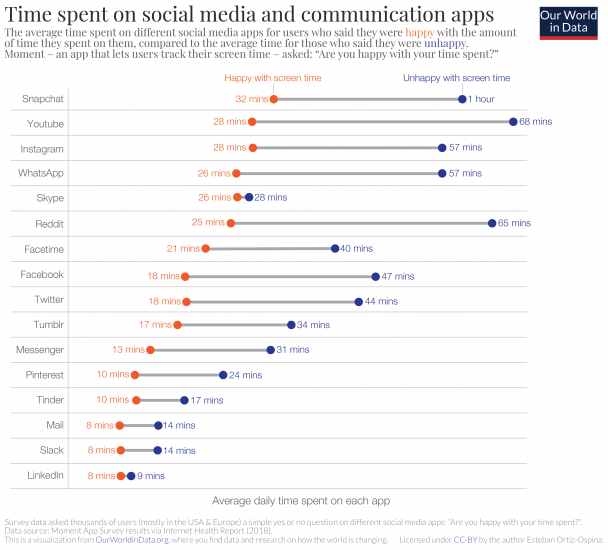
Most of the news stories that claim social media has a negative impact on well-being rely on data from surveys comparing individuals with different levels of social media use as evidence. In the chart below, I show one concrete example of this type of correlational analysis.
The chart plots the average amount of time that people spend on social media each day, among people who are and aren’t happy with the amount of time spent on these platforms.
The data comes from an app called Moment, which tracks the amount of time users spend on social media platforms on their smartphones. The app also asks people a yes/no question: “Are you happy with your time spent?”
As we can see there is quite a bit of heterogeneity across platforms, but the pattern is clear: People who say they are happy with how much time they spend on social media spend less time on these platforms. Or put differently, using social media more heavily is correlated with less satisfaction.
This is certainly interesting, but we should be careful not to jump to conclusions – the correlation actually raises as many questions as it answers.46
Does this pattern hold if we control for user characteristics like age and gender? Would we get similar results if we focused on other measures of well-being beyond ‘happy with time spent’?
The answer to both questions is ‘no’. Depending on what outcome variables you focus on, and depending on which demographic characteristics you account for, you will get a different result. It is therefore not surprising that some empirical academic studies have found negative correlations; while others actually report positive correlations.47
Amy Orben and Andrew Przybylski published a paper earlier this year in the journal Nature where they illustrated that given the flexibility to analyze the data (i.e. given the number of possible choices researchers have when it comes to processing and interpreting the vast data from these large surveys), scientists could have written thousands of papers describing positive, negative and non-significant associations. Different ways of measuring well-being and social media use will yield different results, even for the same population.48
Even the answers to some of the most fundamental questions are unclear: Do we actually know in which direction the relationship might be going? Does frequent social media use translate into lower happiness, or is it the other way around – are anxious, stressed or depressed people particularly prone to use social media?
This takes us to another branch of the literature: longitudinal studies that track individuals over time to measure changes in social media use and well-being.
One longitudinal study that has received much attention on this subject was published by Holly Shakya and Nicholas Christakis in the American Journal of Epidemiology in 2017. It used data from a survey that tracked a group of 5,208 Americans over the period 2013 – 2015, and found an increase in Facebook activity was associated with a future decrease in reported mental health.49
Two years later, Amy Orben, Tobias Dienlin and Andrew Przybylski published a paper in the Proceedings of the National Academy of Sciences using a similar source of data. They relied on a longitudinal survey from the UK covering 12,672 teenagers over the period 2009 – 2016, and reached a different conclusion. They found that there was a small and reciprocal relationship: social media use predicted small decreases in life satisfaction; but it was also the case that decreasing life satisfaction predicted subsequent increases in social media use.50
Summarizing their research in The Guardian, Amy Orben and Andrew Przybylski explained: “we did find some small trends over time – these were mostly clustered in data provided by teenage girls… But – and this is key – it’s not an exaggeration to say that these effects were minuscule by the standards of science and trivial if you want to inform personal parenting decisions. Our results indicated that 99.6% of the variability in adolescent girls’ satisfaction with life had nothing to do with how much they used social media.”
In their paper Orben and co-authors argue again that these large datasets allow many different types of empirical tests; so it is natural to expect conflicting results across studies, particularly if there is noise in measurement and the true effect sizes are small.51
Orben and co-authors tested thousands of empirical tests and indeed, some of these tests could have been interpreted on their own as evidence of a strong negative effect for social media – but clearly the broader picture is important. When looking at the results from all their thousands of tests, they concluded that social media effects were nuanced, small at best and reciprocal over time.52
Establishing causal impacts through observational studies that track the well-being of individuals over time is difficult.
First, there are measurement issues. Long-run surveys that track people are expensive and impose a high burden on participants, so they do not allow in-depth high-frequency data collection, and instead focus on broad trends across a wide range of topics. Orben and co-authors, for example, rely on the Understanding Society Survey from the UK, which covers a wide range of themes such as family life, education, employment, finance, health and wellbeing. Specifically on social media use, this survey only ask how many hours teenagers remember using apps during normal weekdays, which is of course an informative but noisy measure of actual use (a fact that Orben and co-authors mention in their paper).
Second, there are limitations from unobservable variables. Frequent users of social media are likely different from less frequent users in ways that are hard to measure – no matter how many questions you include in a survey, there will always be relevant factors you cannot account for in the analysis.
Given these limitations, an obvious alternative is to run an experiment: you can, for example, offer people money to stop using Facebook for a while and then check the effect by comparing these “treated participants” against a control group that is allowed to continue using Facebook as usual.53
Several recent papers followed this approach. Here I’ll discuss one of them in particular, because I find its approach particularly compelling. The analysis relies on a much larger sample than other experiments, and the researchers registered a pre-analysis plan to insure themselves against the ‘analytical flexibility’ criticisms discussed above.54
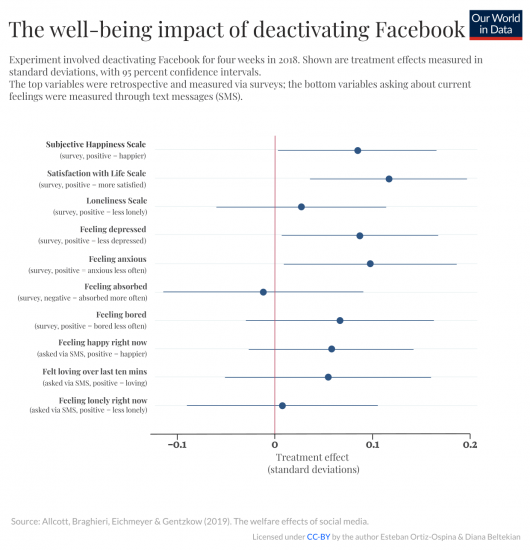
This experiment was done by four economists: Hunt Allcott, Sarah Eichmeyer, Luca Braghieri and Matthew Gentzkow. They recruited 2753 Facebook users in the US, and randomly selected half of them to stop using Facebook for four weeks. They found that deactivating Facebook led to small but statistically significant improvements in some measures of self-reported well-being.55
The chart below shows a summary of their estimated effect sizes. As we can see, for all measures the effects are small (amounting to only around a tenth of the standard deviation of the studied variable), and in most cases the effects are actually not statistically significant (the ‘whiskers’ denoting 95% confidence intervals often include an effect of size zero).56
Allcott and co-authors also compare the treatment effects against the observational correlations in their sample and conclude: “the magnitudes of our causal effects are far smaller than those we would have estimated using the correlational approach of much prior literature”.57
The relatively small experimental effect of social media use on subjective well-being has been replicated. Another experiment conducted almost at the same time and with a very similar approach, produced similar results.58
In the US, where many of these studies have been conducted, roughly two-thirds of people get news from social media, and these platforms have already become a more widely accessed source of news than print newspapers.
I think this link between social media, news consumption and well-being is key.
In their experiment, Allcott and coauthors found that quitting Facebook did not lead people to use alternative online or offline news sources; so those in the treatment group reported spending less time consuming news overall. This tells us that the effect of social media on well-being is not only relatively small, but also likely mediated by the specific types of content and information that people are exposed to.59
The fact that news consumption via social media might be an important factor affecting well-being is not surprising if we consider that news are typically biased towards negative content, and there is empirical research suggesting people are triggered, at a physiological level, when exposed to negative news content.60
Building and reinforcing a scary overarching narrative around “the terrible negative effects of social media on well-being” is unhelpful because this fails to recognise that social media is a large and evolving ecosystem where billions of people interact and consume information in many different ways.
The first takeaway is that the association between social media and well-being is complex and reciprocal, which means that simple correlations can be misleading. A careful analysis of survey data reveals that, yes, there is a correlation between social media and well-being; but the relationship works both ways. This becomes clear from the longitudinal studies: Higher use of social media predicts decreases in life satisfaction; and decreasing life satisfaction also predicts subsequent increases in social media use.
The second takeaway is that the causal effect of social media on well-being is likely small for the average person. The best empirical evidence suggests the impact is much smaller than many news stories suggest and most people believe.
There is much to be learned about how to make better use of these digital platforms, and there is an important discussion to be had about the opportunity costs of spending a large fraction of our time online. But for this we need to look beyond the sweeping newspaper headlines.
We need research with more granular data to unpack diverse use patterns, to understand the different effects that certain types of content have on specific population groups. Time alone is a poor metric to gauge effects. As Andrew Przybylski put it: nobody would argue we should study the causes of obesity by investigating ‘food time’.
Going forward, the conversation in policy and the news should be much more about strategies to promote positive content and interactions, than about one-size-fits-all restrictions on social media ‘screen time’.
- Data Source: Multiple sources
- Description of available measures: Estimates of the share of single-person households across different places and times, using a selection of the available historical records and more recent census data
- Geographical coverage: Selected towns and cities
- Link: https://www.tandfonline.com/doi/pdf/10.1080/03071022.2017.1256093
- Data Source: Survey of 20,000 Americans
- Description of available measures: Self-reported loneliness
- Geographical coverage: US
- Link: https://www.cigna.com/about-us/newsroom/studies-and-reports/loneliness-epidemic-america
- Data Source: Community Life Survey
- Description of available measures: Self-reported loneliness
- Geographical coverage: UK
- Link: https://www.ons.gov.uk
- Data Source: Representative national surveys
- Description of available measures: Share of people who interact with friends at least once per month
- Geographical coverage: Selected countries
- Link: http://www.worldvaluessurvey.org/
- Data Source: Multiple sources
- Description of available measures: Percentage of one-person households as a ratio of total households
- Geographical coverage: Global, by country
- Link: https://population.un.org/Household/index.html#/countries/840
- Data Source: Multiple sources
- Description of available measures: Percentage of people who report that they have friends or relatives whom they can count on in times of trouble
- Geographical coverage: Global, by country
- Link: https://www.oecd-ilibrary.org/economics/how-s-life-2017_how_life-2017-en
- Data Source: Multiple sources
- Description of available measures: Social media use
- Geographical coverage: Global, by country
- Link: https://doi.org/10.1787/soc_glance-2019-en