More than half of the world’s population now live in urban areas — increasingly in highly-dense cities. However, urban settings are a relatively new phenomenon in human history. This transition has transformed the way we live, work, travel and build networks.
This entry presents an overview of urbanization across the world, extending from the distant past, to present, and projections of future trends.
Summary
- More than 4 billion people live in urban areas globally.
- The UN estimates 2007 was the year when, for the first time, more people in the world lived in urban than in rural areas.
- Estimates on urban populations vary – mainly as a result of disagreements on the exact definition of an ‘urban area’ and what this includes.
- Just under 1-in-3 people in urban areas globally live in a slum household.
- For most of human history, populations lived in very low-density rural settings. Urbanization is a trend unique to the past few centuries.
- By 2050 it’s projected that more than two-thirds of the world population will live in urban areas.
- It’s projected that close to 7 billion people will live in urban areas in 2050.
- People tend to migrate from rural to urban areas as they become richer.
- Living standards tend to be higher in urban areas.
All our charts on Urbanization
Number of people living in urban areas
For most of human history, most people across the world lived in small communities. Over the past few centuries – and particularly in recent decades – this has shifted dramatically. There has been a mass migration of populations from rural to urban areas.
How many people live in urban areas today?
In the visualization we see estimates from the UN World Urbanization Prospects on the number of people globally who live in urban and rural areas. In 2017, 4.1 billion people were living in urban areas.
This means over half of the world (55%) live in urban settings. The UN estimates this milestone event – when the number of people in urban areas overtook the number in rural settings – occurred in 2007.
You can explore the data on urban and rural populations for any country or region using the “change country” toggle on the interactive chart.

Share of populations living in urban areas
How does the share of people living in urban areas vary between countries?
In the map shown here we see the share of the population that is urbanized across the world.
Across most high-income countries – across Western Europe, the Americas, Australia, Japan and the Middle East – more than 80% of the population live in urban areas. Across most upper-middle income countries – in Eastern Europe, East Asia, North and Southern Africa, and South America – between 50% to 80% of people do. In many low to lower-middle income countries, the majority still live in rural areas.
But this is changing quickly. By clicking on any country you can see how urbanization rates are changing with time. For many countries, you see a rapid migration of populations into towns and cities.

Before looking in more detail at the differences in estimates of urban populations, we should first clarify what we do know:
- globally more people live in urbanized settings than not (disputes in these figures are all above the 50 percent urban mark);
- the broad distribution and density of where people live across the world (sometimes at very high resolution);
- although it can seem like our expanding cities take up a lot of land, only around 1% of global land is defined as built-up area;1
- rates of urbanization have been increasing rapidly across all regions (in 1800, less than 10 percent of people across all regions lived in urban areas);
- urbanization is expected to continue to increase with rising incomes and shifts away from employment in agriculture;2
- disagreements in urban population numbers arise from definition or boundary differences in what makes a population ‘urban’.
Whilst disagreement on the numbers can seem irrelevant, understanding cities, urbanization rates, the distribution and density of people matters. The allocation and distribution of resources — ranging from housing and transport access to healthcare, education, and employment opportunities — should all be dependent on where people live. Understanding the distribution of people in a given country is essential to make sure the appropriate resources and services are available where they’re needed.
The UN’s 11th Sustainable Development Goal (SDG) is to “make cities inclusive, safe, resilient and sustainable“. If our aim is to develop resource-efficient, inclusive cities, understanding how many people they must provide for is essential for urban planning.
Let’s therefore look at the conflicting estimates of how urban our world is, and where these differences come from.
At first glance this seems like a simple question to answer. Figures reported from the United Nations (UN) deliver a straightforward answer.3
In the chart below we see the total number of people defined as living in urban and rural areas, extending from 1960 to 2016.4 This is based on nationally-collated census figures, combined with UN estimates where census data is unavailable. Here we see that in 1960 twice as many people lived in rural settings (2 billion) than in urban areas (1 billion). In 2007, urban and rural populations were almost exactly equal at 3.33 billion each. In 2016, urban populations increased to 4 billion; while the world’s rural population had increased only marginally to 3.4 billion.
UN estimates therefore report that 54 percent of people in the world lived in urban areas in 2016. Using UN Urbanization Prospects projections, in 2018 this is estimated to be just over 55 percent of the world.5
The UN figures are the most widely referenced and cited on global urbanization. However, they’re not without their critics: some researchers suggest that far more people live in urban areas than these figures suggest. Why are they so contested?

‘What defines an urban area?’ lies at the centre of these debates.
There is currently no universal definition of what ‘urban’ means. The UN reports figures based on nationally-defined urban shares. The problem, however, is that countries adopt very different definitions of urbanization. Not only do the thresholds of urban versus rural vary, but the types of metrics used also differ. Some countries use minimum population thresholds, others use population density, infrastructure development, employment type, or simply the population of pre-defined cities.
In the table below we highlight the varied definitions across a selection of countries. The UN World Urbanization Prospects database also provides the full downloadable list of statistical definitions for each country.
The table illustrates the broad range of definitions between countries which compromises cross-country comparisons. And since the reported global figure is simply the sum of nationally-reported shares, the lack of a universal definition is also problematic for these aggregated figures.
Even if we could define a single metric to use — such as a minimum population threshold in a settlement — countries adopt very different threshold levels. In the chart below we have mapped the minimum population threshold for countries who adopt this within their definition of ‘urban’. 2000 and 5000 inhabitants were jointly the most frequently-adopted threshold. However, the variation across countries was vast. Sweden and Denmark set this threshold at only 200 inhabitants; Japan at 50,000 (a 250-fold difference).
National definitions of ‘urban area’ as used for a custom selection of countries6
| Country | National definition of 'urban' |
|---|---|
| Argentina | Localities with 2,000 inhabitants or more. |
| Sweden | Built-up areas with 200 inhabitants or more and where houses are at most 200 metres apart. |
| Japan | Cities defined as shi. In general, shi refers to a municipality that satisfies the following conditions: (1) 50,000 inhabitants or more; (2) 60 per cent or more of the houses located in the main built-up areas; (3) 60 per cent or more of the population (including their dependents) engaged in manufacturing, trade or other urban type of business. |
| India | Statutory places with a municipality, corporation, cantonment board or notified town area committee and places satisfying all of the following three criteria: (1) 5,000 inhabitants or more; (2) at least 75 per cent of male working population engaged in non-agricultural pursuits; and (3) at least 400 inhabitants per square kilometre. |
| Zimbabwe | Places officially designated as urban, as well as places with 2,500 inhabitants or more whose population resides in a compact settlement pattern and where more than 50 per cent of the employed persons are engaged in non-agricultural occupations. |
| Singapore | Entire population. |
| Uruguay | Cities officially designated as such. |

Critics of current UN figures therefore contest that such varied definitions of ‘urban’ lead to a significant underestimation of the world’s urban population. Researchers from the European Commission, for example, reported that 85 percent of people live in urban areas.7
Its project, Atlas of the Human Planet, combines high-resolution satellite imagery with national census data to derive its estimates of urban and rural settlements.
The European Commission applied a universal definition of settlements across all countries:
- Urban centre: must have a minimum of 50,000 inhabitants plus a population density of at least 1500 people per square kilometre (km2) or density of build-up area greater than 50 percent.
- Urban cluster: must have a minimum of 5,000 inhabitants plus a population density of at least 300 people per square kilometre (km2).
- Rural: fewer than 5,000 inhabitants.
Using these definitions, it reports that 52 percent of the world lived in urban centres, 33 percent in urban clusters, and 15 percent in rural areas in 2015. This makes the total urban share 85 percent (more than 6.1 billion people). The reported urban share by continent is shown in the chart below.
The European Commission’s estimates are also not without its critics. Researchers at the Marron Institute of Urban Management (New York University) challenged these figures as a gross overestimation.8
The authors suggest multiple reasons why such figures are too high: based on agricultural employment figures, they estimate urban populations cannot exceed 60 percent; the low urban-density threshold adopted by the European Commission means entire cropland regions are classified as urban; and that this low-density threshold is inconsistent with observed population densities on the fringes of cities.

Clearly how we define an urban area has a significant impact on its estimated population. UN figures report 4 billion, whilst the European Commission reports 6 billion (a difference of one-third).
Whilst there is clearly differences in estimates at the global level, the overall trend in urbanization at national levels (regardless of their definition) is still important. It’s vital for India, for example, to know that from 1990 to 2016, its urban population increased by 148 million (increasing from every 4th to every 3rd person). The rate of this change is important for its evaluation of progress, demographic change, and national planning. The lack of consensus on figures at the global level therefore shouldn’t overshadow what they represent at national levels.
But would the world adopt a standardized definition? The UN Statistics Division aims to convene an expert group (featuring representatives from 24 member states) later this year to try to reach consensus. It’s not the first time this has been attempted though: two previous meetings have failed in finding a common definition. With the aim of having countries adopt this definition for their own estimates, it would have to gain a very high approval rate.
With such a wide array of national definitions, it will be a difficult task. Countries have the right to define what they consider to be urban and rural settlements. One proposed option is to maintain individual definitions for national figures, but to adopt a new universal definition for estimating the global and/or regional share.
This may, at least, bring us one step closer to agreement on how urban the world really is.
Share of people living in slums
Quality of living standards in urban centres is of course an important measure of wellbeing. One metric of living standards is the share of the urban population living in slum households. A slum household is defined as a group of individuals living under the same roof lacking one or more of the following conditions: access to improved water, access to improved sanitation, sufficient living area, and durability of housing.
The most recent global estimates suggest just under 1-in-3 people in urban areas lived in slum households.
The share of the urban population living in slums by country is shown in the chart. This data is available from the year 1990. Here we see that in the latest data, most countries across Asia and Latin America had between 10 to 30 percent of urban populations living in slum households (some slightly higher). Slum households were most prevalent across Sub-Saharan Africa; most had more than half of urban populations living in slum households, and some (such as Sudan, South Sudan, and Central African Republic) had more than 90 percent.
We see that over time, for most countries, the share of the urban population living in slums has been falling. From 1990 to 2014, for example, the share of the urban population in slum households fell from:
- 44 to 25 percent in China;
- 55 to 24 percent in India;
- 37 to 22 percent in Brazil;
- 77 to 50 percent in Nigeria.

Numbers living in urban slums
How many people are living in urban slums? In the chart we see the total number of people living in urban slum households, and the urban population not living in slums. This is available to view by country using the “change country” option in the bottom-left of the chart. Here we see that despite continued population growth and urbanization rates across most countries, the absolute number of people living in urban slum households has also been falling across many countries.
A map of total number of people living in urban slum households by country is available to explore here.

Although the definition of ‘urban’ gives us some indication of population densities, it does not differentiate between those that live in small versus large urban settings. In the chart we show the percentage of the total population which live in agglomerations greater than one million people (i.e. large urban agglomerations). These figures are available in absolute terms (the total number of people living in large urban settings), found here.
Here we see large differences across the world. Smaller city-based nations such as Kuwait, UAE, Japan, Puerto Rico and Israel tend to have high rates of large urban agglomeration: more than half live in large cities. Across much of the Americas, 40 to 50 percent live in large urban agglomerations. Most other countries across Europe, Asia and Africa lie somewhere in the range of 10 to 40 percent.
There are a few countries which have a very low prevalence of large cities — in Germany and the Netherlands, for example, less than 10 percent of the population live in cities over 1 million despite having large urbanisation rates.

We can also look at this centralisation effect through the share of the urban population which lives in the single largest city. This is shown in chart.
Here we have a handful of countries — such as Mongolia, Paraguay, Uruguay, Liberia, Senegal and Afghanistan — where more than half of the country’s urban population live in its largest city. Overall, this share tends to be higher in countries across Africa and Latin America; a share of 30 to 50 percent is common. Rates across Europe, Asia and North America are highly variable, ranging from over 40 percent to less than 10 percent.

In the chart we see the world mapped based on the population of each country’s capital city. In 2018, Japan’s capital — Tokyo — had the largest population of the world’s capital cities at over 37 million people. This was followed by Delhi (India) at over 28 million; Mexico City (Mexico) at 21 million; and Cairo (Egypt) with 20 million.
Across the world the most common capital size was in the range of 1 to 5 million people.

Many cities across the world have grown rapidly over the past 50 years in terms of total population. The chart shows the estimated population of the world’s 30 largest cities (by 2015 population) from 1950 to 2015, with projections through to 2035.9
Beijing in 1950, for example, had a population of 1.7 million. By 2015 this was more than 10 times higher, at more than 18 million. By 2035 it’s expected this will increase further to 25 million. Dhaka (capital of Bangladesh) increased from less than half a million in 1950 to almost 18 million in 2015 (and projected to reach 31 million by 2030). Using the “change city” in the bottom-left of the chart, you can browse trends for the largest 30 cities.
Related chart – population density of cities. This chart shows the population density of cities across the world.

Urbanization over the past 500 years
How has urbanization changed over longer timescales – over the past 500 years?
In the map here we see how the share of populations living in urban areas has changed in recent curies. Data on urban shares dating back to 1500 are available only for select countries, with an estimated share at the global level. Using the timeline on the map (or by clicking on a country) you can see how this share has changed over time.
Here we see clearly again that urbanization has largely been confined to the past 200 years. By 1800, still over 90 percent of the global (and country-level) population lived in rural areas. Urbanization in the United States began to increase rapidly through the 19th century, reaching 40 percent by 1900.10
By 1950 this reached 64%, and nearly 80% by 2000.
This rate of urbanization was, however, outpaced by Japan. Urban shares in Japan were low until the 20th century.11
By 1900, it had just surpassed 1-in-10. This increased rapidly, reaching over half of the population by 1950; nearly 80 percent by 2000, and surpassing the USA to over 90 percent today.
China and India had not dissimilar rates of urbanization until the late 1980s.12 By then, both had around 1-in-4 living in urban areas. However, China’s rate of urbanization increased rapidly over the 1990s, and 2000s. Over this 30-year period its urban share more than doubled to 58 percent. India’s rise has continued to steadily rise to 1-in-3 (33 percent) today.

Urbanization over the past 12,000 years
The recency of urbanization becomes even more pronounced when we look at trends for countries and regions over even longer timescales – the past 10,000 years. This is shown in the visualization here, derived from the work of the History Database of the Global Environment.13
As we see, urban living is a very recent development. For most of our history humans lived in low-density, rural settings. Prior to 1600, it’s estimated that the share of the world population living in urban settings did not reach 5%. By 1800, this share reached 7%; and by 1900 had increased to 16%.
Related chart – urban land area over the past 10,000 years. This chart shows the change in urban land area dating back to 10,000 BC.

What share of people will live in urban areas in the future?
The past 50 years in particular have seen a rapid increase in rates of urbanization across the world. Are these trends likely to continue?
The UN World Urbanization Prospects provides estimates of urban shares across the world through to 2050. These projections are shown in the chart — using the timeline you can watch this change over time.
Across all countries urban shares are projected to increase in the coming decades, although at varied rates. By 2050, it’s projected that 68 percent of the world’s population will live in urban areas (an increase from 54 percent in 2016). In fact, by 2050 there are very few countries where rural shares are expected to be higher than urban. These include several across Sub-Saharan Africa, Asia, Pacific Island States, and Guyana in Latin America.
Why, when most countries are expected to be majority urban, does the global total just over two-thirds? This seems low, but results from the fact that many of the world’s most populated countries have comparably low urban shares (either just over half, or less). For example, India (expected to be the world’s most populous country), is projected to have an urban share of only 53 percent in 2050.
The other map shown here provides a snapshot overview of how the world is expected to continue to become more urbanized. It shows, for any given country, whether more people (the majority) live in urban or rural areas.
Using the timeline feature and “play” button in the bottom-left of the chart, you can explore how this has changed over time. In 1950, it was predominantly high-income countries across Europe, the Americas, Australasia and Japan who were largely urban. A century later — in 2050 — it’s projected that most countries will have more people living in urban areas than not.


How many people will live in urban areas in the future?
In the chart we see estimates of urban and rural populations in absolute terms, projected through to 2050. Projected population growth based on the UN’s medium fertility scenario. As of 2018 we see that there is around 7.6 billion people in the world (4.2 billion in urban and 3.4 billion in rural areas).
By 2050, global population is projected to increase to around 9.8 billion. It’s estimated that more than twice as many people in the world will be living in urban (6.7 billion) than in rural settings (3.1 billion).
These trends can be explored by country or region using the “change country” function in the bottom-left of the chart.
Using our timeline map of urbanization you can explore how countries are expected to transition from predominantly rural to urban in the coming decades. There we see that by 2050 it’s projected that the majority of countries will have a majority (greater than 50 percent) of people living in urban areas.

Populations urbanize as they get richer
In the chart we show the relationship between the share of the population living in urban areas (y-axis) and average income (gross domestic product per capita) on the x-axis. Here we see a strong relationship between urbanization and income: as countries get richer, they tend to become more urbanized.
The link between urbanization and economic growth has been well-documented.14,15,16
Urbanization is complex, however there are many recognised benefits of urban settings (when developed successfully) including high-density of economic activity, shorter trade links, utilisation of human capital, shared infrastructure and division of labour.17,18,19
Is there a causal feedback by which urbanization is also a predictor of future economic growth? The evidence for this is relatively weak — assessments of this effect suggest that countries with a higher initial urban population share do not achieve faster or slower economic growth than countries with a low initial urban population share.20

Urban populations tend to have higher living standards
There are many examples — across broad areas of development — which suggest that, on average, living standards are higher in urban populations than in rural. Some examples include:
- in nearly all countries electricity access is higher in urban areas than in rural areas;
- access to improved sanitation is higher in urban areas;
- access to improved drinking water is higher in urban areas;
- access to clean fuels for cooking and heating is higher in urban areas;
- child malnutrition is lower in urban settings.
Note, however, that it is difficult to infer causality between urbanization and these examples. Since urbanization shows a strong correlation with income, such relationships may instead simply show the effect of higher incomes on electricity access, sanitation, drinking water and nutrition. Furthermore, there can also be significant inequalities within urban areas; this is evidenced by the fact that across many low-to-middle income countries a high share of the urban population live in slum households (which lack access to all of the basic resources).
Agricultural employment falls with urbanization
It would be expected that changing where populations live will have an impact on types of employment. Rural-urban migration has been empirically linked with the structural transformation process: as urban population shares increase, employment tends to shift from agriculture towards industry/manufacturing, or services.21
In the chart we see the share of people employed who are in agriculture (y-axis) versus the share of the population living in urban areas. Here, in general, we see that agricultural employment tends to decline with urbanization. In our blog post ‘Structural transformation: how did today’s rich countries become ‘deindustrialized’? we discuss and look at the data on this agriculture-industry-services shift in more detail.
Although this agriculture-urbanization link tends to hold true for most countries, there are a couple of clear outliers. Sri Lanka, Samoa, and Barbados, for example, appear to show relatively low levels of agricultural employment despite being predominantly rural. For Sri Lanka, this anomaly is explained by low urbanization rates, rather than relatively low levels of agricultural employment — a labour share of just under 30 percent in agriculture is not dissimilar for neighbouring countries in the Asia-Pacific region. In the case of Barbados and Saint Lucia: low agricultural production and employment is common for many small island states.

How is an urban population defined?
There is no universal definition of what constitutes an ‘urban area’. Definitions of an urban settlement vary widely across countries, both in terms of the metrics used to define them, and their threshold level. The UN World Urbanization Prospects (2018) database provides a downloadable list of underlying data sources and the statistical concepts used to define ‘urban’ by country.22
In the chart we have mapped the minimum threshold level of the number of inhabitants in a settlement needed for it to be classified as an ‘urban area’. The data shown for a given country is its nationally-defined minimum threshold. When we look at the frequency at which a given threshold level is used by a country, we see that 2000 and 5000 inhabitants are the most frequently adopted (by 23 countries each). However, these ranges vary widely: Sweden and Denmark, for example, use a threshold of only 200 inhabitants whereas Japan adopts a very high threshold of 50,000 inhabitants.
Note that 133 countries do not use a minimum settlement population threshold in their ‘urban’ definition. Some use a variation of population density, infrastructure development, pre-assigned city populations, or in some cases no clear definition.
The UN adopts national definitions in its reporting of urban versus rural populations. This means urban populations are often not comparable across countries. Global urbanization trends also encounter this issue: world urban population is reported as the sum of nationally-defined urban populations (therefore summing metrics/thresholds which are not directly comparable).
How is a slum household defined?
UN-HABITAT defines a slum household as a group of individuals living under the same roof in an urban area who lack one or more of the following23:
1. Durable housing of a permanent nature that protects against extreme climate conditions.
2. Sufficient living space which means not more than three people sharing the same room.
3. Easy access to safe water in sufficient amounts at an affordable price.
4. Access to adequate sanitation in the form of a private or public toilet shared by a reasonable number of people.
Sometimes a fifth criteria is included:
5. Security of tenure that prevents forced evictions.
It should be noted that although a single categorisation of a ‘slum household’ is given, the conditions and level of deprivation can vary significantly between slum households. Some households may lack only one of the above criteria, whereas others may lack several.
How is urban density defined?
The density of a geographic area is measured on the basis of the average number of people per unit of area (for example, the number of people per square kilometre, km2). It’s therefore calculated as the population divided by the land area for that given population.
But what does urban density mean? Here, again, we encounter the difficulty in agreeing on the standard boundary definition of what constitutes an urban area. The standard metric adopted (and encouraged) by the UN for urban density is the so-called “urban agglomeration population density”.
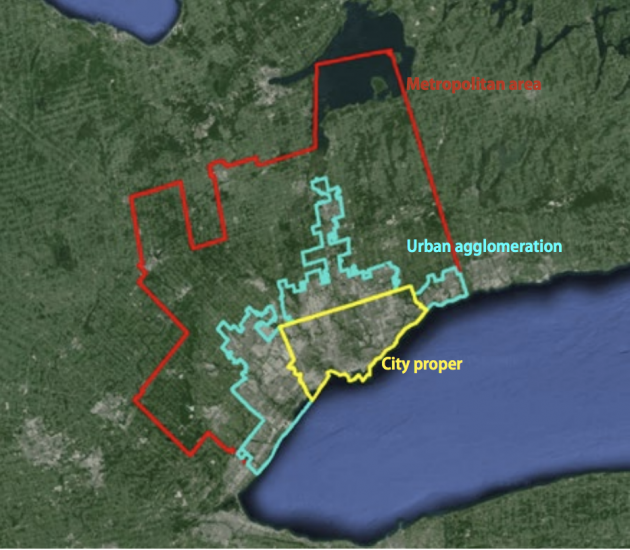
Urban agglomeration is defined by the UN as:
The term “urban agglomeration” refers to the population contained within the contours of a contiguous territory inhabited at urban density levels without regard to administrative boundaries. It usually incorporates the population in a city or town plus that in the suburban areas lying outside of, but being adjacent to, the city boundaries. Whenever possible, data classified according to the concept of urban agglomeration are used. However, some countries do not produce data according to the concept of urban agglomeration but use instead that of metropolitan area or city proper. If possible, such data are adjusted to conform to the concept urban agglomeration. When sufficient information is not available to permit such an adjustment, data based on the concept of city proper or metropolitan area are used.
This figure, which shows the urban definition boundaries for Toronto, is used by the UN to demonstrate these differences.24
Here we therefore see that the most commonly used definition of “urban agglomeration” is based on the population and area size of the central city or town plus its close suburban sprawls.
Boundaries which could be used to define an urban area, based on the example of Toronto.25
- Data: Long-term urbanization rate and urban area
- Geographical coverage:Global, by region and select countries
- Time span: 10,000 BC to 2000 AD
- Available at: Online here
- Data: Historic urban population size; projections of future urbanization trends
- Geographical coverage: Global, by region and by country
- Time span: 1950 to present; projections to 2050
- Available at: Online here
- Data: Urban populations, urban area, population density, urban conditions
- Geographical coverage: Global, by region, country and city
- Time span: Mixed data availability (some extend from 1950 to 2050 projections)
- Available at: Online here
- Data: Urban and rural population; share of urban population in slum households
- Geographical coverage: Global, across all regions and countries
- Time span: Most metrics available from 1990 onwards; some from 1960 onwards
- Available at: Online here